Motivation: Interpreting data

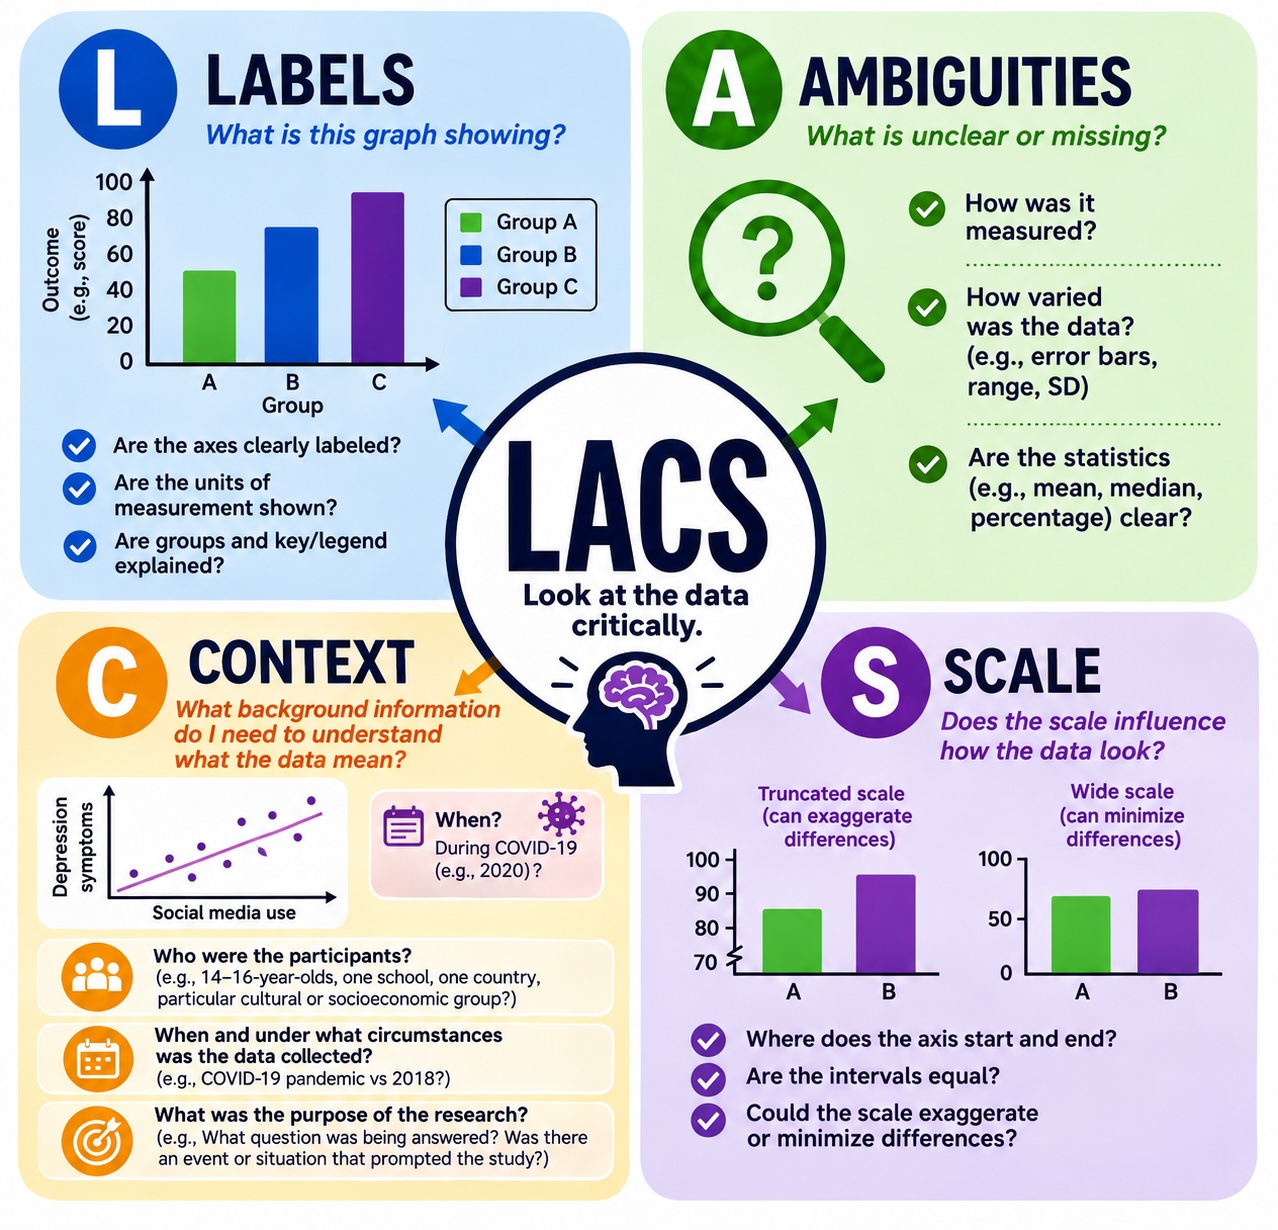
Below you will find six graphs that represent data relevant to topics in motivation research. Each graph has issues that limit our ability to interpret the data in relation to a claim.
As you will have to do on Paper 3, question 1, identify one problem with each graph and then explain how it limits our ability to interpret the data.
Use the LACS framework to help you find the problem.
You may want to assign this as an online task for students. You might also want students to work in groups to find the problems and discuss as a class.
A worksheet with the six graphs is included here.
 Motivation: Paper 3 practice Questions 1
Claim 1. Group B has greater intrinsic motivation than Group A
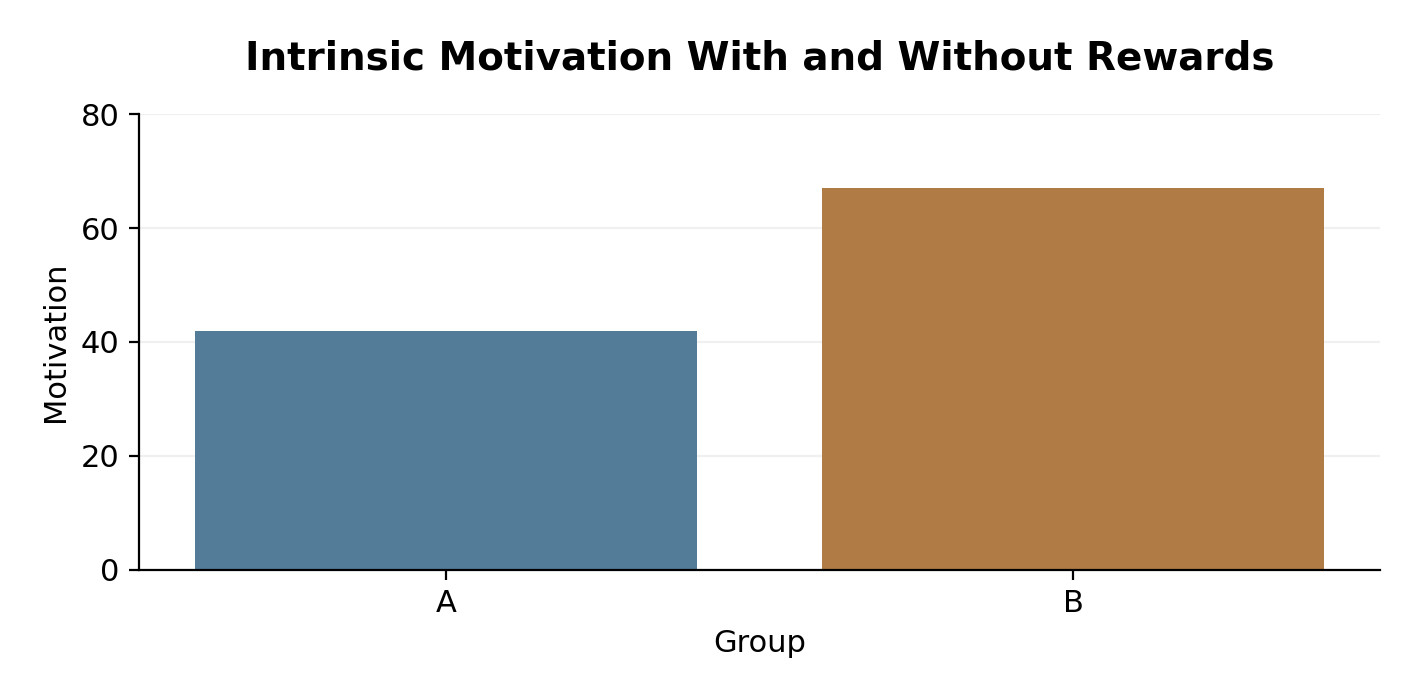
L — Labels: The title identifies the intended comparison, but Groups A and B are not explained. We cannot tell which group received rewards. The vertical axis says only “Motivation,” without identifying units or the measurement scale.
A — Ambiguities: The graph does not explain how intrinsic motivation was measured or whether the bars represent means, medians, frequency, or another statistic. Consequently, the values of 42 and 67 have no clear interpretation. No information about variation is provided.
C — Context: The participants, activity, rewards, and timing of measurement are unspecified. Motivation to study for an examination may differ from motivation to play a game, for example.
S — Scale: The graph does not identify the measure’s possible range. We cannot tell whether the displayed maximum of 80 represents the scale’s upper limit or simply a presentation choice.
Why does this matter? Although B has a higher plotted value than A, the unexplained group labels prevent us from determining whether the rewarded or unrewarded group scored higher. Missing information about the measure and statistic also prevents us from interpreting the 25-point difference or judging its practical importance. If the bars represent averages, they do not establish that every person in B scored higher than every person in A.
Claim 2. Students in the badges condition were three times as motivated as those in the no badges condition
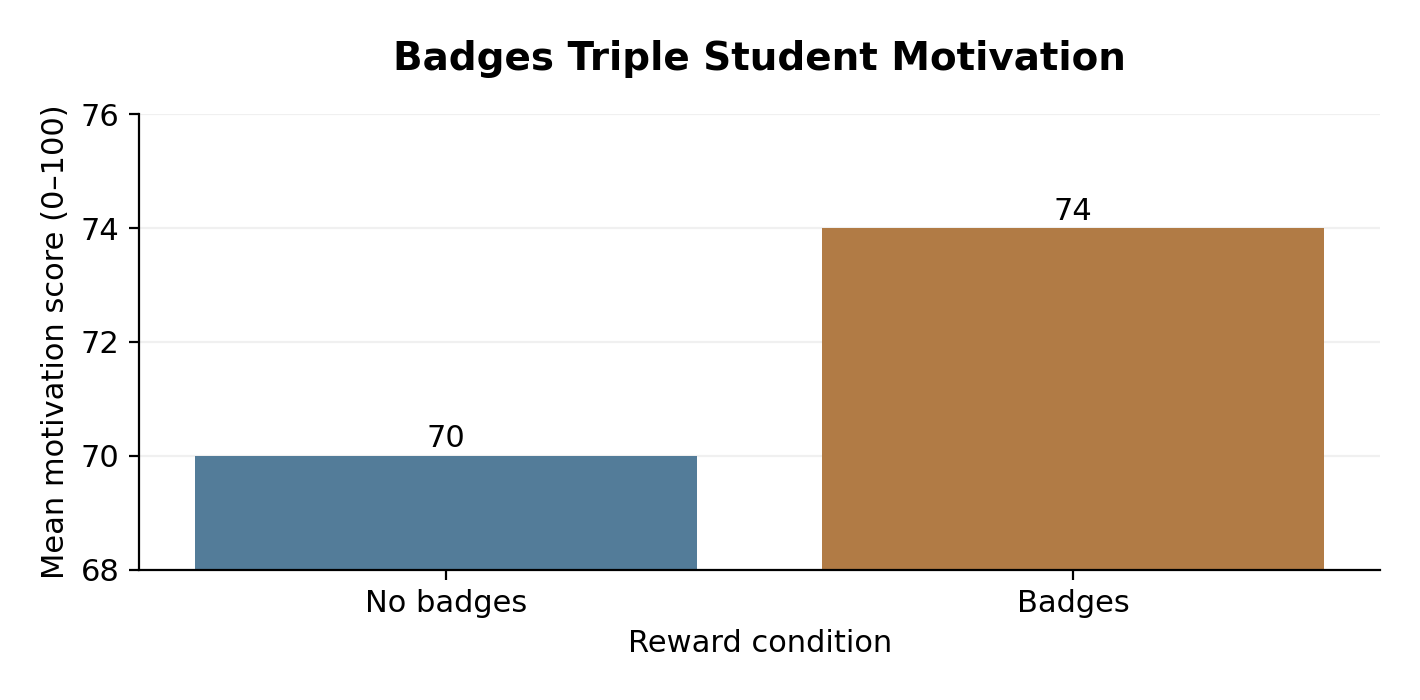
L — Labels: The title claims that badges triple motivation, while the actual means are 70 and 74. It also implies that badges caused the difference.
A — Ambiguities: The graph does not explain what the motivation scores represent or what the scale’s endpoints mean. No individual scores or measure of variation are shown, so we cannot tell how much the groups overlap. The four-point difference alone does not establish statistical significance or practical importance.
C — Context: The students’ ages, the activity, the type of badges, and the timing of measurement are unspecified. These details matter when interpreting what students were motivated to do and where the findings might apply.
S — Scale: The vertical axis starts at 68 rather than zero. The visible bars therefore have heights of 2 and 6 units, making the badges bar appear three times as tall. This exaggerates the difference between scores of 70 and 74. Furthermore, a motivation rating does not necessarily support ratio statements such as “three times as motivated,” even when calculated from the full scores.
Why does this matter? The truncated axis creates a misleading visual ratio that reinforces the unsupported title. The data show a four-point difference in mean ratings, not a tripling of motivation. Missing information about variation and the meaning of the scores limits judgments about how significant the difference is.
Claim 3. Every student became more motivated after receiving feedback.
The same 30 students rated their motivation before and after feedback.
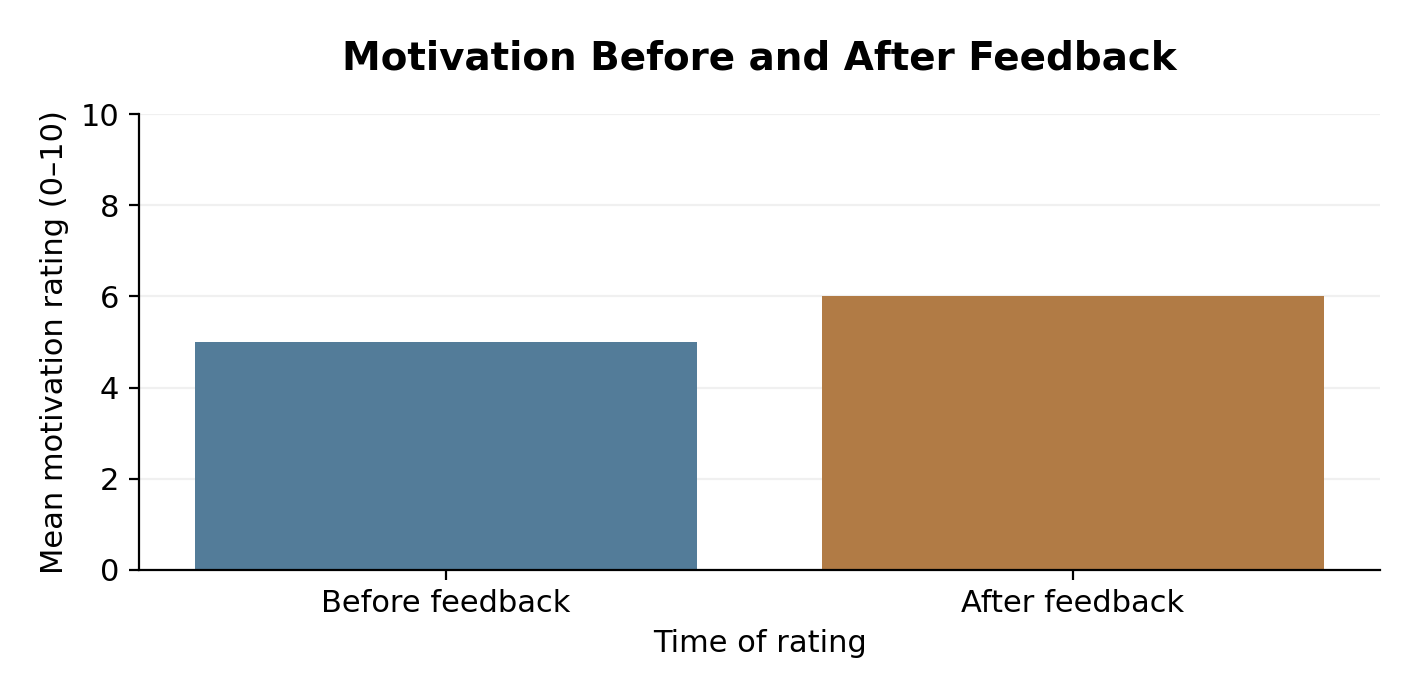
A — Ambiguities: Only the means are displayed. We cannot see individual changes or variation around each mean. The increase from 5 to 6 could reflect small increases for everyone, large increases for some students, or a mixture of increases and decreases. The graph also does not explain how motivation was measured. Without further statistical information, we cannot determine whether the difference is statistically significant.
C — Context: We know that the same 30 students provided both ratings, but their ages, educational setting, task, and type of feedback are unspecified. The timing of the second rating is also unclear: an immediate response would not establish a lasting improvement.
Why does this matter? An increase in the group mean does not support the claim that every student became more motivated. Some students may have remained unchanged or become less motivated. Missing information about variation and the meaning of the scale also limits judgments about the importance of the difference.
Claim 4. Team goals are more motivating than individual goals for secondary school students doing homework
These data describe 80 adult volunteers at a local running club during a four-week challenge. Scores indicate motivation to train.
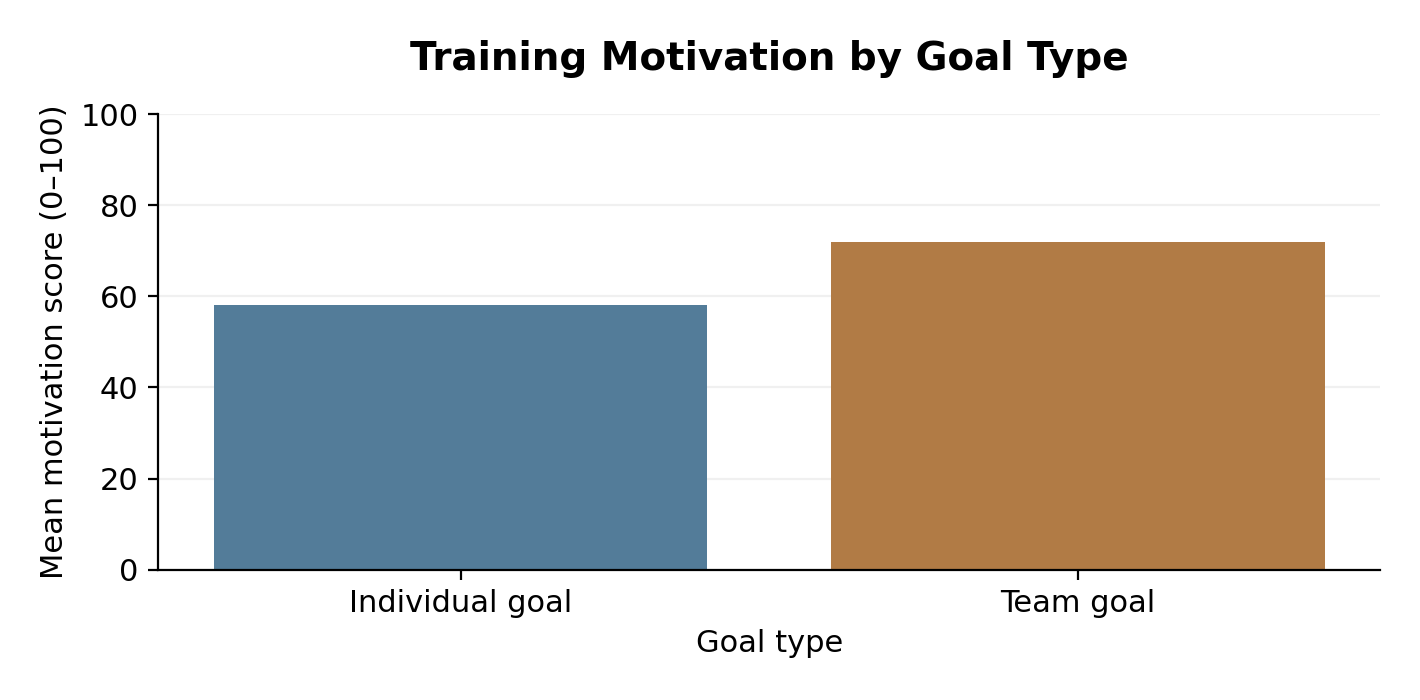
L — Labels: The title identifies training motivation, which differs from motivation to complete homework.
A — Ambiguities: Missing variation. The means are 58 and 72, but no individual scores or measure of spread are shown. The groups could overlap considerably, so we cannot conclude that everyone with a team goal was more motivated than everyone with an individual goal.
The axis identifies a 0–100 motivation score, but does not explain what the scores represent or how they were calculated. A 14-point difference does not automatically establish a meaningful practical difference.
C — Context: “During a four-week challenge” does not specify whether motivation was measured at the beginning, at the end, or averaged across the challenge. The graph cannot show that either group’s motivation increased.
Why this matters: The higher mean for the team-goal group does not show that every participant was more motivated; without information about variation, the groups could overlap considerably. The 14-point difference also does not establish that motivation increased over time or that team goals caused higher motivation. Without an explanation of the score, its practical importance is unclear. Finally, findings about adult runners’ motivation to train cannot automatically be applied to secondary school students doing homework.
Claim 5. Increasing a student’s exercise will cause their academic motivation to increase
Each point represents one student. Both variables were measured during the same week.
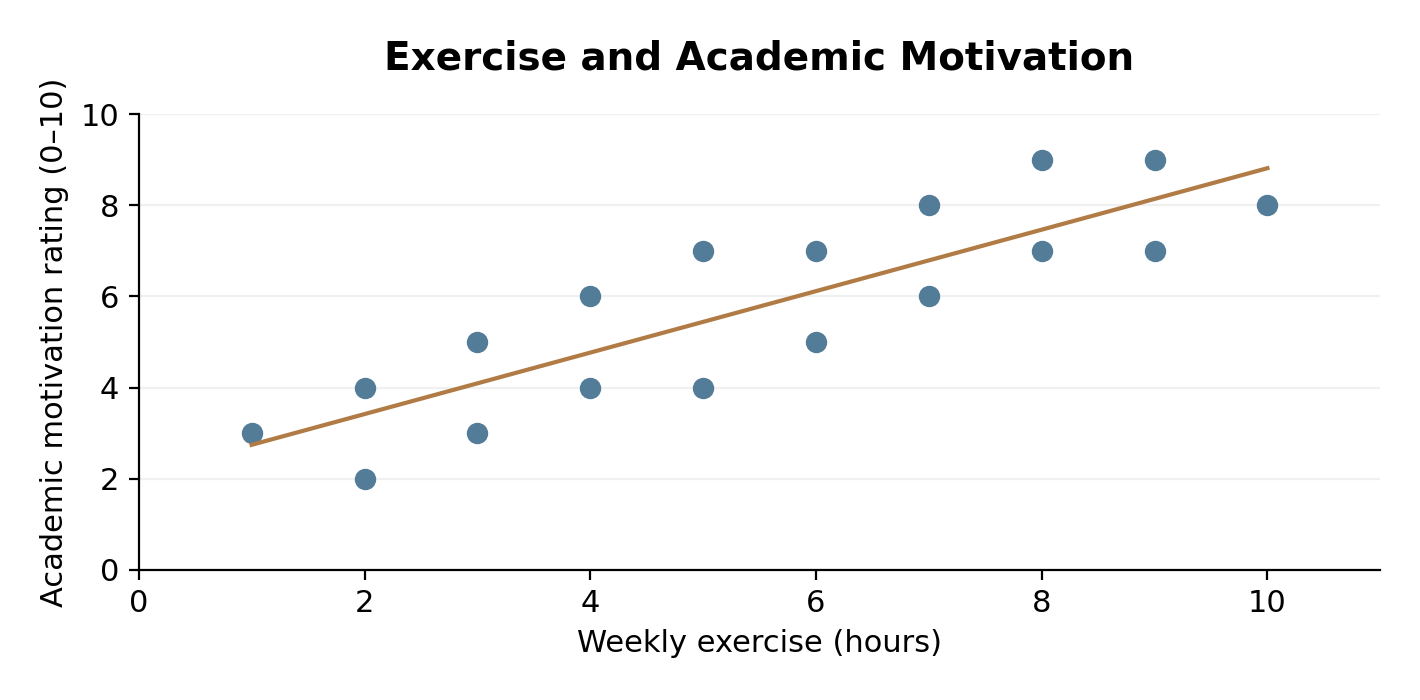
A — Ambiguities: The graph does not explain how academic motivation was measured or what the ratings represent. No correlation coefficient is provided, so the strength of the correlation is unspecified.
C — Context: The students’ ages, educational setting, and circumstances are not stated, limiting where the findings can reasonably be applied. Both variables were measured during the same week, so their temporal order is unknown. More exercise might contribute to motivation, more motivated students might exercise more, or another factor—such as wellbeing—might relate to both. These are possible explanations, not findings established by the graph.
Why this matters: The graph shows a positive association between exercise and academic motivation, but it does not establish that increasing exercise will improve motivation. The variation around the line also means that students who exercise more are not invariably more motivated. Unclear score meanings and missing contextual information limit judgments about the relationship’s practical importance and its relevance to other students.
Claim 6. Motivation increased at a constant rate of 10 points per week throughout the program
The same students rated their motivation at weeks 1, 2, 6, and 12 of a program.
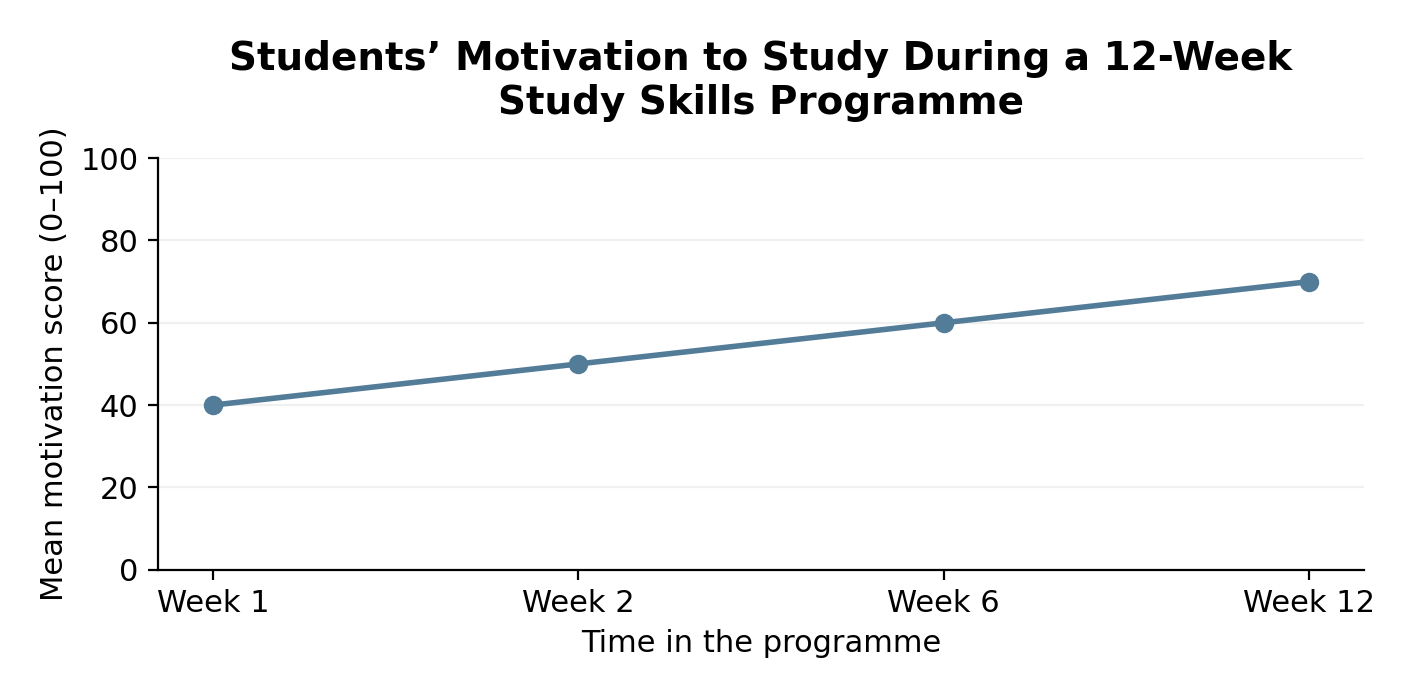
L — Labels: The vertical axis identifies a mean motivation score on a 0–100 scale, but does not explain what the scale’s endpoints represent.
A — Ambiguities: Only means are shown, so we cannot see variation between students or determine how many became more motivated. The graph also does not explain how motivation was measured. Connecting the points may suggest a continuous, steady increase, but motivation between measurement occasions is unknown.
C — Context: The students’ ages, educational setting, and the program's content are unspecified.
S — Scale: The main problem is the horizontal spacing. Weeks 1, 2, 6 and 12 are equally spaced even though the gaps are 1, 4 and 6 weeks. This makes equal ten-point increases appear to represent a constant rate. The actual average increases are:
| Interval | Average increase per week |
|---|---|
| Week 1 to week 2 | 10 points |
| Week 2 to week 6 | 2.5 points |
| Week 6 to week 12 | About 1.67 points |
Why does this matter? The misleading time spacing makes motivation appear to rise at a constant rate, although the average weekly increase becomes smaller across successive intervals. The means do not show that every student improved, and the connecting lines cannot establish what happened between measurements.