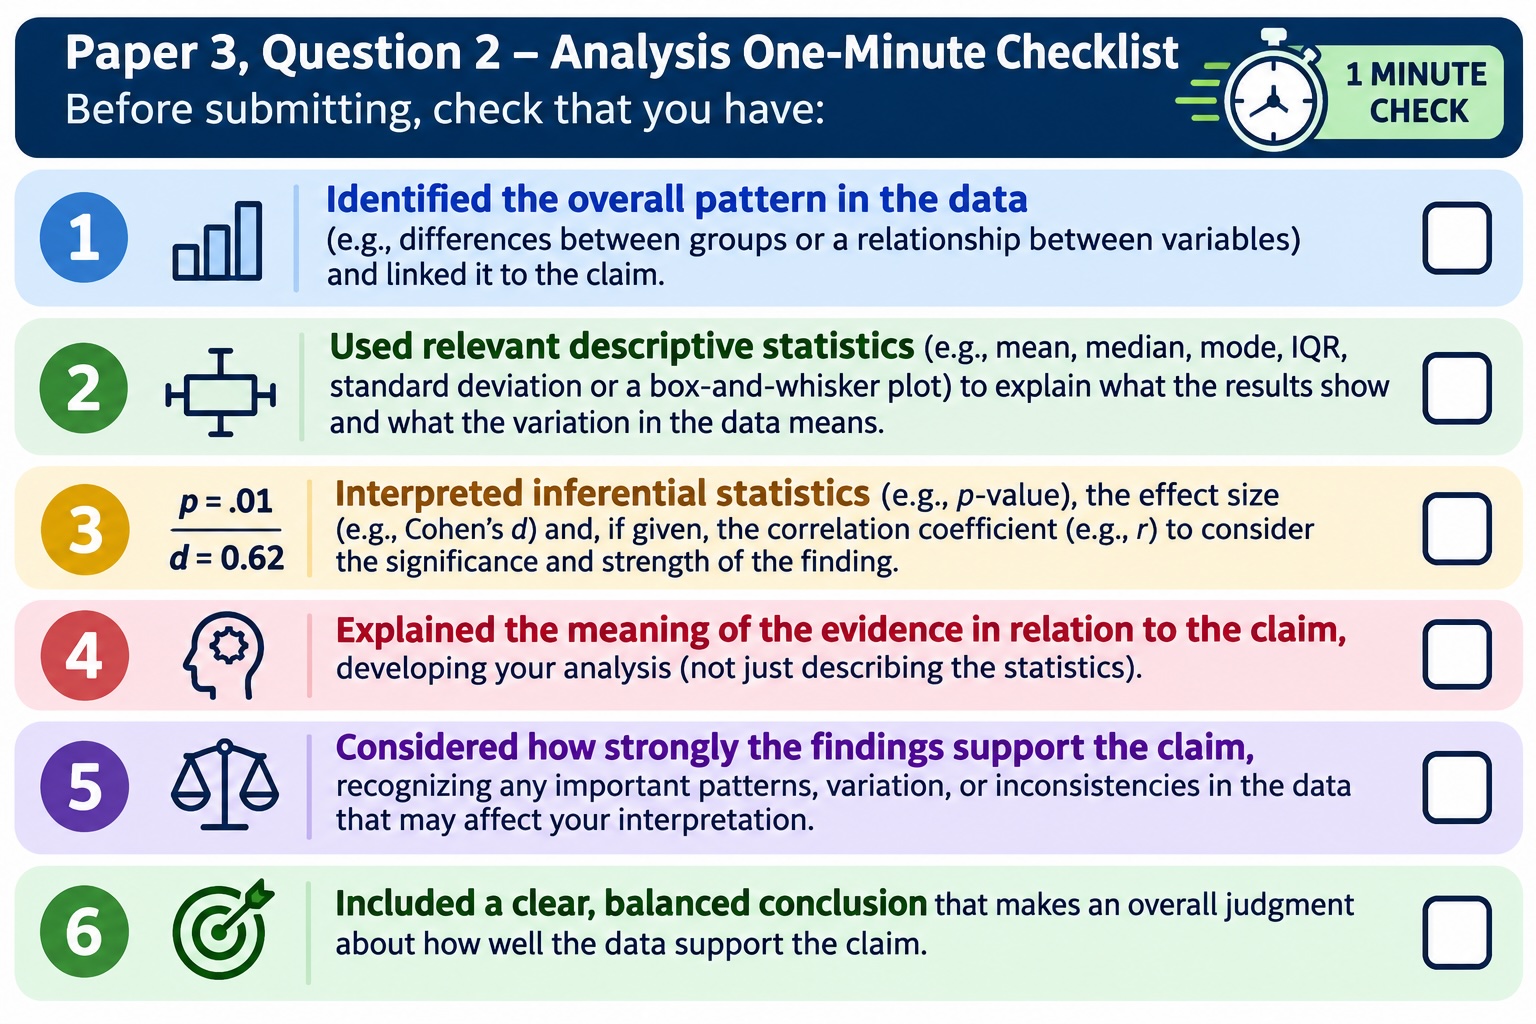
Tips: Paper 3 Q2

Below you will find advice on how to answer question 2 on Paper 3.
In Question 2, you are expected to analyze the data to determine whether they support the claim. Simply describing the statistics is not enough. You need to explain what the results mean and how they help you evaluate the claim.
6 Tips for Success on Paper 3, Question 2
- Identify the overall pattern in the data Begin by identifying the most important finding. Look for differences between groups, trends, or relationships between variables. Use the mean, median, or mode, where available, to establish the general pattern. Don't just state that one group scored higher. Explain what the difference suggests about the claim.
- Consider how much variation there is in the data If the standard deviation, IQR, range, or a box-and-whisker plot is provided, use it to examine how much the scores vary within or between groups. Explain why the spread of scores matters. A difference between group averages may be less convincing if there is considerable variation or overlap between the groups.
- Remember that statistical significance does not establish causation. A small p-value does not tell us how strong a relationship is, and a large sample can produce statistically significant results even when the effect is small.
- Explain what the data tell us about the claim The examiner expects development, which means unpacking the meaning of the statistics rather than simply reporting them. After discussing a statistic, ask yourself: So what? What does this tell me about the claim?
- Consider what the data cannot tell us. Good analysis recognizes the limitations of the conclusions that can be drawn from the statistics. Focus on limitations that are relevant to interpreting the data and evaluating the claim. Avoid generic criticisms that do not help explain the findings.
- Finish with a clear, balanced conclusion Even if you have linked your analysis to the claim throughout your response, you must include a final conclusion. Without one, the maximum mark for the response is 3 marks. Your conclusion should make an overall judgment about the extent to which the data support the claim. Consider the strength and consistency of the findings, as well as any important qualifications.
A sample conclusion
The data support the claim that greater globalization exposure is associated with higher psychological distress, as the median distress scores increase across the three groups and the difference is statistically significant. However, the greater variation in the high-exposure group and the possibility of other influencing factors mean that the findings do not establish a causal relationship.
Tip: Don't simply repeat the results. Make a judgment about how convincingly the evidence supports the claim.
Suggested paragraph structure
I recommend two paragraphs, focusing on the most relevant statistics and what they tell us about the claim.
Paragraph 1: Identify the overall pattern
- Describe the main pattern or relationship using descriptive statistics (e.g., mean, median, mode).
- Use other relevant statistics (e.g., IQR, standard deviation, p-value, effect size, correlation coefficient) or a box-and-whisker plot to explain the variation, significance, or strength of the data.
- Explain how the findings support or challenge the claim.
Remember: Don't just describe the statistics. Explain what they mean in relation to the claim.
You do not need to discuss every statistic provided. Two or three well-developed points are better than a long list of statistics without explanation.
Paragraph 2: Draw a conclusion
- Make a clear judgment about how strongly the data support the claim.
- Justify your conclusion using the most important findings.
The key to achieving 5–6 marks: Accurate, detailed analysis of the data, with a final conclusion explicitly linked to the findings.