Action potentials (2025)

Neurons can propagate impulses down the axon at speeds over 300 km/h. The speed of the action potential can vary due to different factors such as myelination and axon diameter. These will be discussed and then a simulation will be used to discover how to use correlation coefficients.
Lesson description
Starting questions
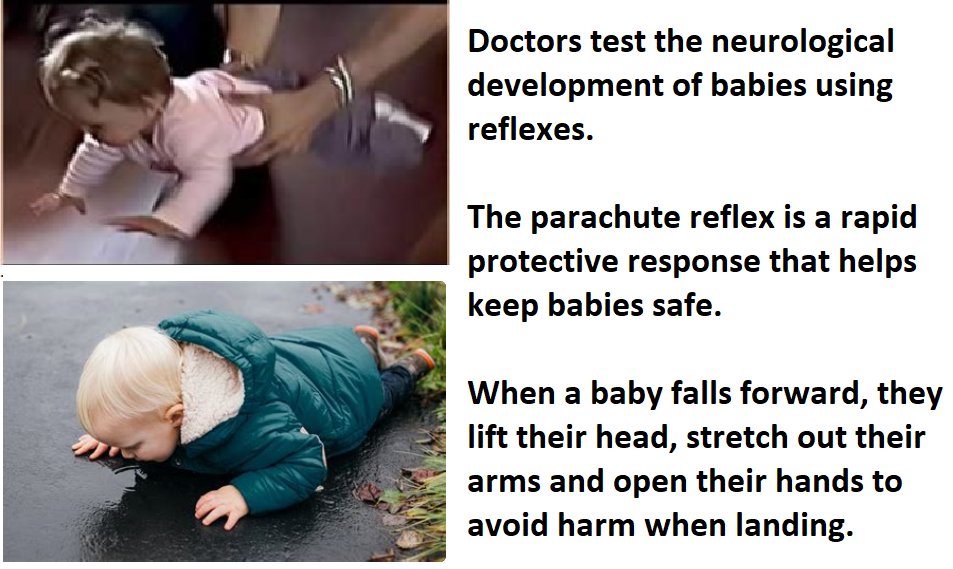
Why do babies have the parachute reflex?
(shown in the pictures)
What role to neurons have in the parachute reflex?
How does it happen so rapidly?
Activity 1 - Action potential propagation
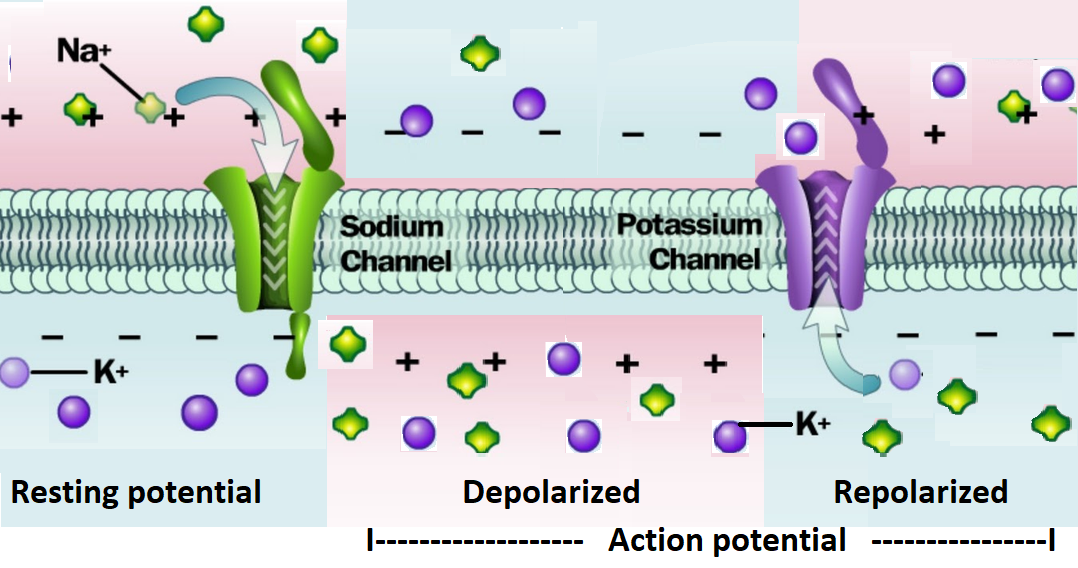
A nerve impulse is described as the propagation of an action potential along the axon of a neurone.
- The resting potential is established before the action potential
- Positive ions (Na+) cross the axon membrane into the axon, depolarising it,
- Different positive ions (K+) flood out of the axon, repolarizing it.
- This spreads along the axon.
The animation below shows a ‘Mexican wave’ which represents the propagation of an action potential.
It's a simple model, but it illustrates propagation very well.
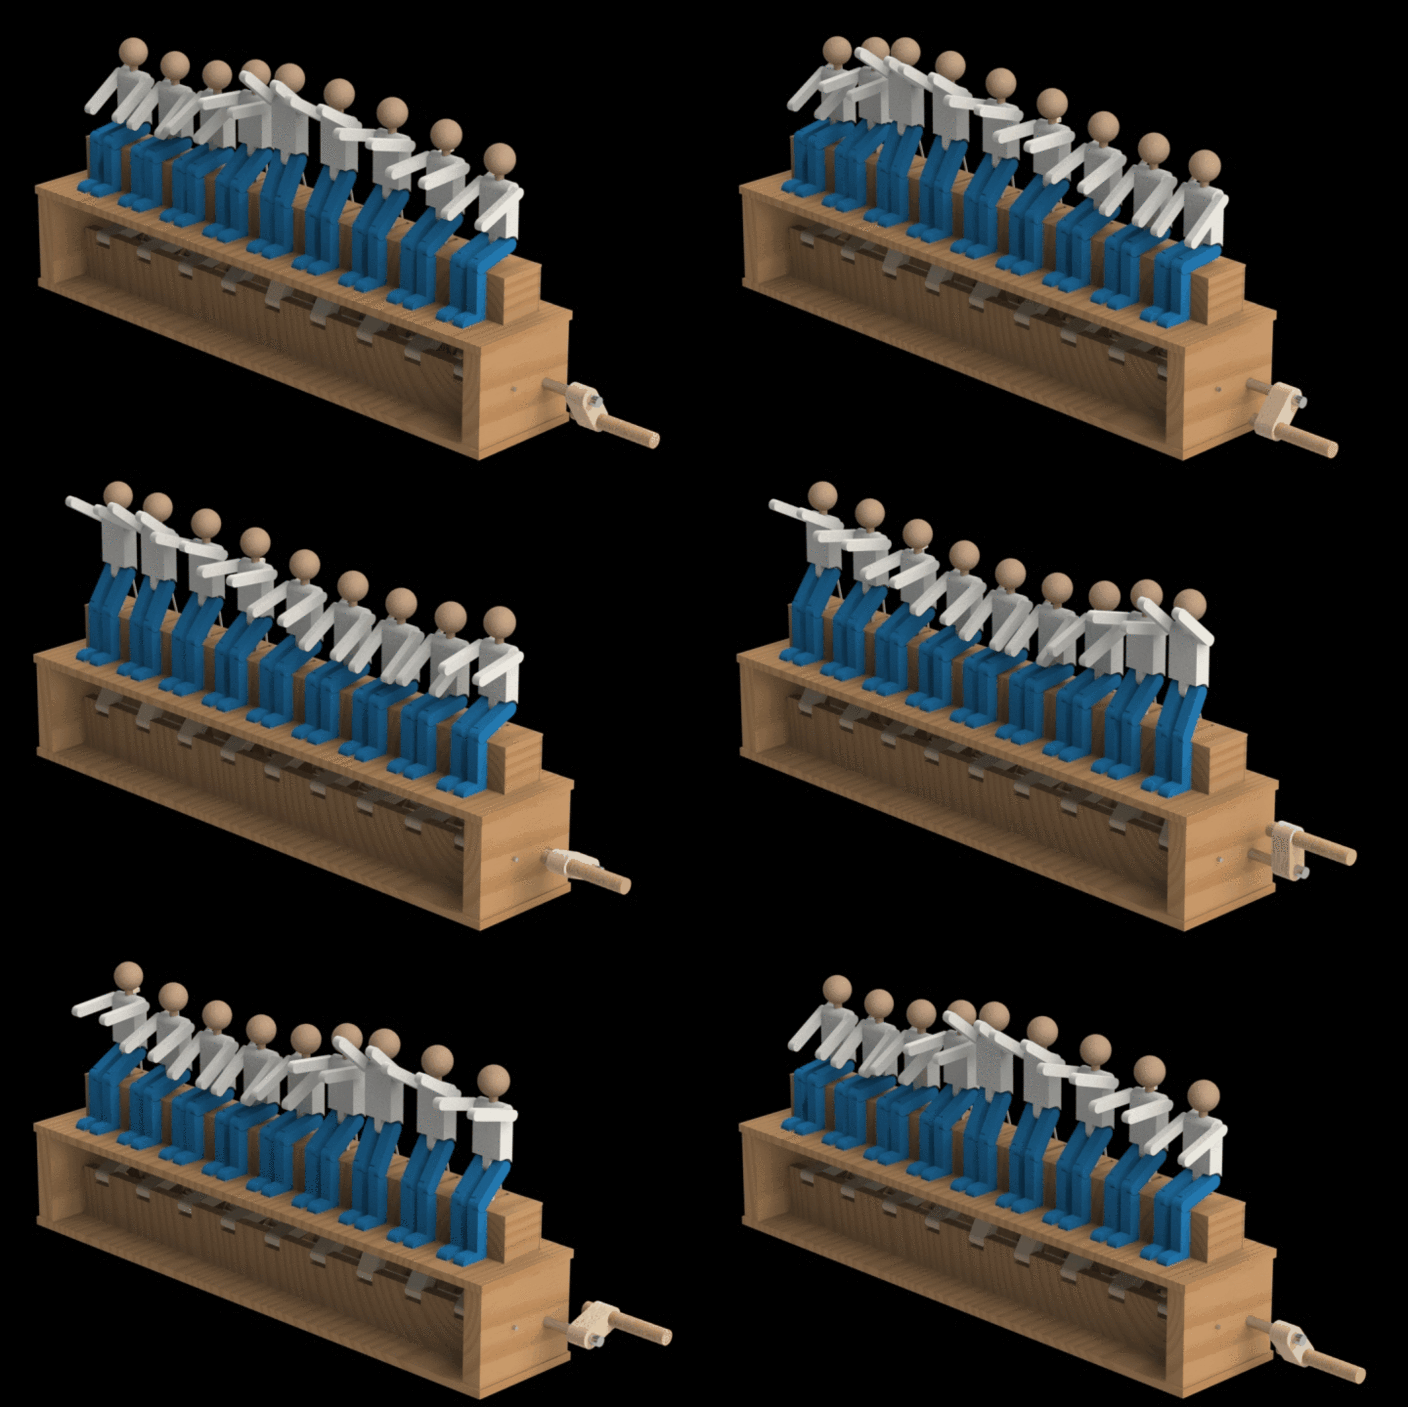
Image source: Wikimedia CC-BY-SA-4.0 by Yam2002
Questions
What might the different parts of the animation represent in the model?
- The wooden box.
....................................................................................................
- The handle at the end of the box.
....................................................................................................
- An individual figure moving down.
.....................................................................................................
- An individual figure moving up.
…………………………………………………………………………
- The movement of each man in turn along the box.
.....................................................................................................
Click the eye icon to reveal model answers.
Model answers
- The wooden box
The axon of the neurone. - The handle.
The stimulus that triggers the nerve impulse along the axon. - An individual figure moving down.
The movement of positively charged ions across the membrane of the axon (causing a temporary reversal in the electrical potential of the membrane). - An individual figure moving up
The movement of positive K+ ions across the membrane (out of the axon) replolarizing it. - The movement of each man in turn along the box.
The propagation of the action potential along the nerve fibre.
This is a link to the Mexican wave animation, just in case!
Activity 2 - Speed of an action potential
An action potential can travel faster if it has a wider diameter, or if it surrounded by myelin sheath cells.
This animation illustrates the effect of axon diameter on impulse speed.
To stimulate an impulse click “Fire impulse race”
- Change the diameter of the neuron axons using the two sliders on the left.
- Fire an impulse race to see what difference the changes make.
Click here to open the impulse visualization in a new window.
NoS - Correlations
The slides below explain the correlation coefficient and the coefficient of determination.


Data can be collected from the animation of action potential propagation above.
Use the online statistical calculator to calculate the Pearson's correlation coefficient ‘r’ and the coefficient of determination, 'r2' from the data.
Follow the steps on the worksheet.  Correlation coefficient calculation activity
This activity uses the website - Pearson Correlation Coefficient Calculator (socscistatistics.com)
Activity 3 - Saltatory conduction
The diagram below shows how saltatory conduction occurs in myelinated axons.
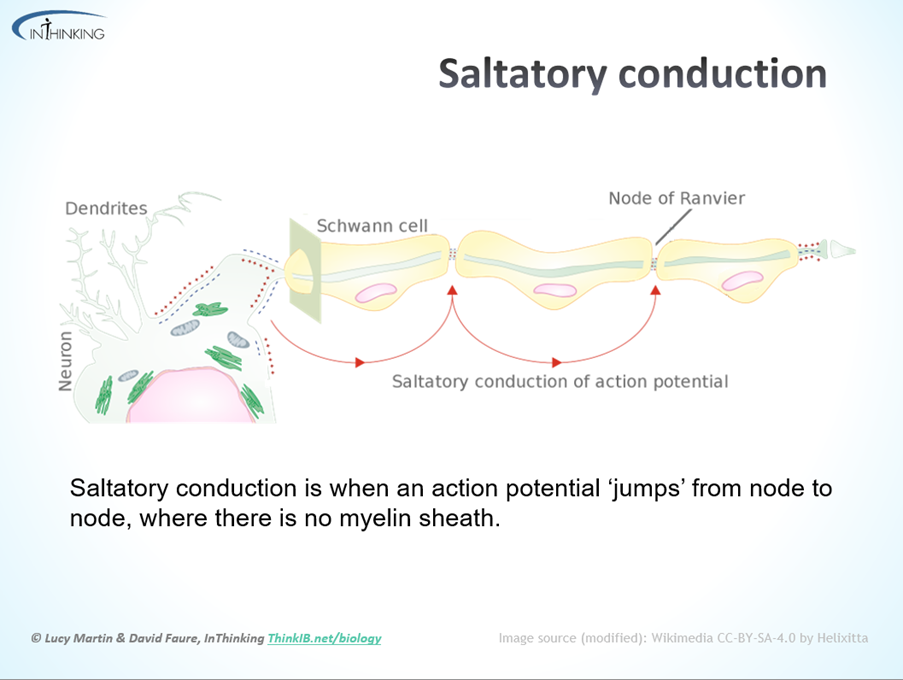
Use this knowledge and the data in the graph to answer the questions on the speed of transmission in axons on the worksheet. Speed of action potentials data questions worksheet
Activity 1 – You can either show this animation and then use it to discuss the movement of ions during action potentials. Or, in larger classes where there are enough students it is always more fun to get them to model the ‘Mexican wave’ themselves. As an extension task, the model could be evaluated.
Please note that the details about nodes and the movement of specific ions is not required for SL so has not been included in this series of activities.
Activity 2 – The image of saltatory conduction at the Nodes of Ranvier can be shown to students. They can then answer the data questions on the worksheet. Please note that the detail about the ion channels and movement at the nodes is only needed for AHL.
Another fun modelling activity is to get the students to model saltatory conduction by getting them to adapt the ‘Mexican wave’ modelling activity from Activity 1. For example, they can stand next to one another to model non-myelinated axons. Each student can only start to put their arms up when the one before them has put theirs back down. Then this can be repeated to compare to myelinated transmission by spreading out the students so that each one is at a ‘node’. They should be able to see that that the nerve impulse can travel over a set distance faster like this. For smaller classes, they could discuss how they might adapt the model to show saltatory conduction.
Activity 3 – Show the slides to introduce the concepts of correlation coefficients and the coefficient of determination. Then get the students to go to the online simulator from Monash University. They should select the axon diameter option at the top of the page and they can then follow the instructions to collect data for myelinate and non-myelinated axons. There is then a link provided to allow them to calculate their ‘r’ values and ‘r2’ values online. They can then see if the correlations are significant using the online stats tool in the link provided in the challenge activity. This is good practice for the IA analysis section.