Data Analysis

Data analysis is all about data collection, presentation and processing. It is expected that sufficient data is collected, even if the experiment has to be repeated if something went wrong the first time. The data should be presented clearly and precisely following the conventions of decimal places, uncertainties, and SI units.
All analysis and data processing should be done with the aim of answering the research question and confirming the variability of data, and significance of the trends. The data and its analysis is used to support the conclusions, so if the analysis is thorough it helps the conclusion to be equally detailed.
It is fine if the analysis shows that there is no trend. Perhaps the variability in the data made it difficult to identify a clear conclusion. This is not penalised, as good marks can be obtained by demonstrating the variability of the data, and writing about a lack of correlation in the analysis.
Data Collection - sufficient and appropriate
The raw data must be presented clearly in a table. Calculations, graphs, or even statistical tests follow from this data through a series of logical steps which are each explained and illustrated using screenshots or formulae.
To do well in this section it is important to do the following:
- Collect enough raw data.
- Present the data clearly – use detailed labels and units.
- Be consistent with decimal points, uncertainties and labels in tables, graphs and calculations.
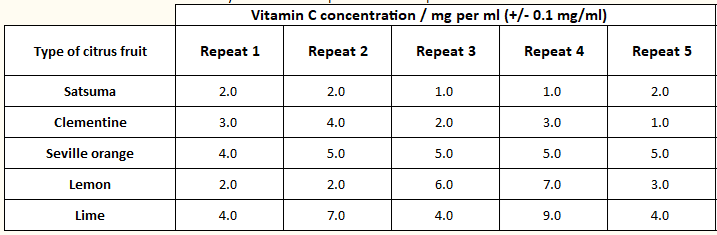
Table 1: Vitamin C concentrations in five citrus fruit, calculated from DCPIP titration volumes.
Check data tables with these questions
- Is the data raw data? Averages, rates and concentrations are not usually raw data unless taken from a data logger.
- Are the Independent variable & Dependent variable both clearly named?
- Is there just one Independent variable?
- Do the Independent variable & Dependent variable match the Research Question?
(Pay special attention to; time taken / rate / mass / concentration) - Does the independent variable have a suitable range of values?
- Are the Independent variable & Dependent variable given with SI units (if they are quantitative).
- Are uncertainties for the Independent variable & Dependent variable consistent with the method & the data d.p.
- Does the Independent variable have at least 5 values (unless it is a paired comparison – when 2 is OK)
- Does the Dependent variable have at least 5 repeats for each value of the Independent variable?
Note: If the study is a paired comparison of two things (or three) then 24 data values in total is usually good.
Data analysis – sufficient and appropriate
Keep it relevant.
- Don’t include repetitive graphs which show raw data, but draw graphs that show relationships between variables.
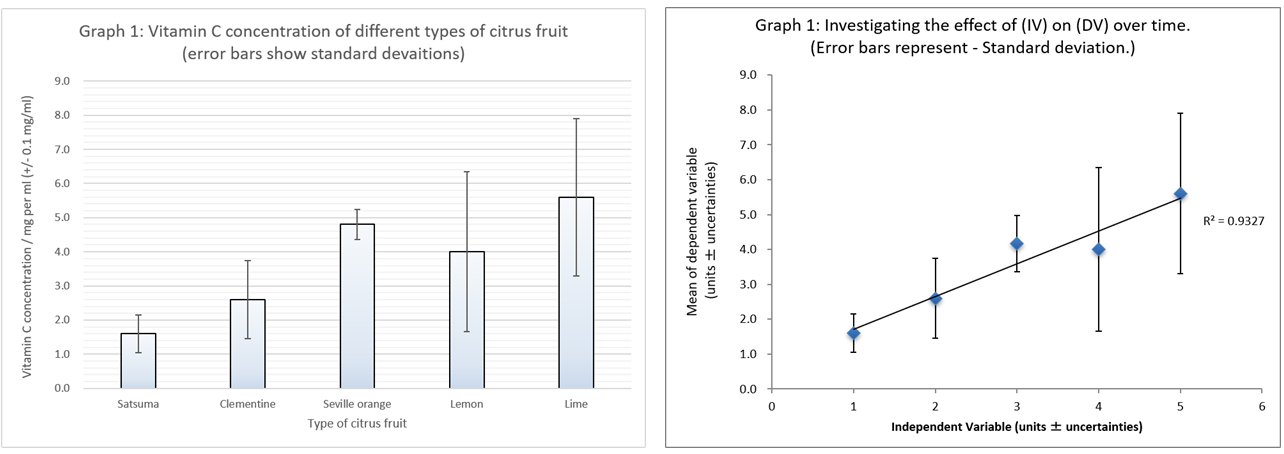
- Make bar graphs that have the independent variable on the horizontal axis, or scatter graphs which have the dependent variable on the vertical axis, and the independent variable on the horizontal axis.
Include a note like this, (+/- 1.0 mm) giving uncertainties in the axes labels.
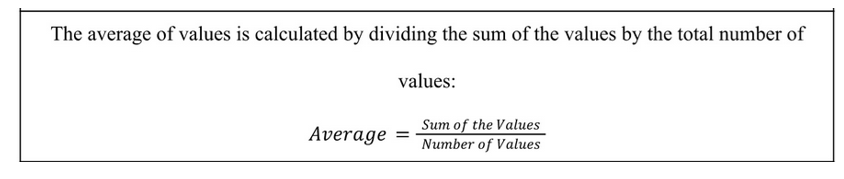
Explain calculations and show an example.
- If a mean average is calculated, also calculate a standard deviation.
- If a correlation is plotted, add a best fit “trendline” and include the coefficient of determination, R2.
- For some students calculating a mean and standard deviation will be enough processing.
To achieve higher marks than 4/6 for the Data analysis one statistical test is usually needed,
e.g. Pearson's correlation coefficient, Spearman's rank correlation coefficient, a T-test, or ANOVA test. All these stats can be calculated using an online calculator, the mathematical understanding of the test is not expected.
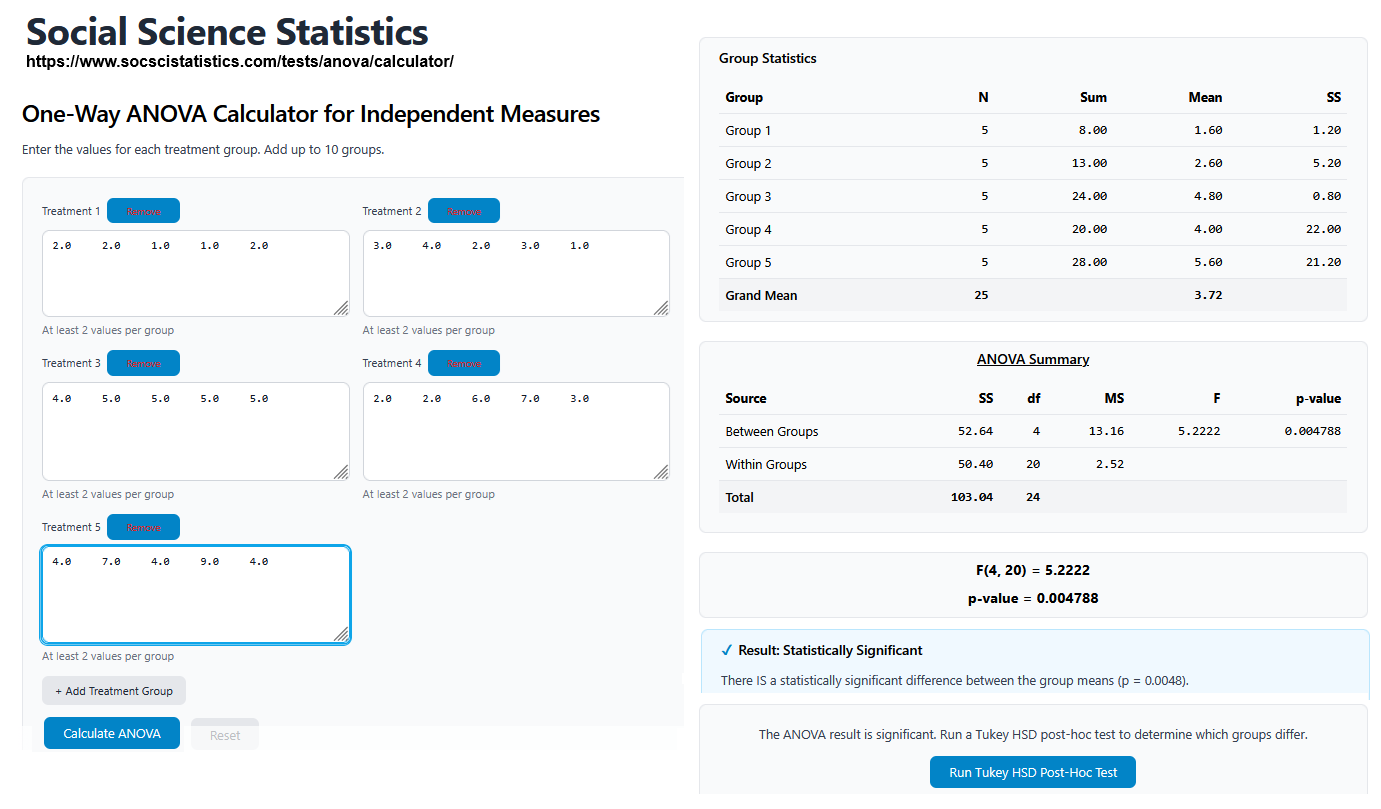
This example shows an ANOVA calculator.