First examiner's report on IA
There are three important sources of information provided by the IB for Biology teachers supervising and marking Internal Assessment:
- The Biology Diploma Guide - Internal assessment p114
- The Teachers support material - Facilitating the IA - Unpacking the IA,
- The Examiner's reports - Subject reports
The first examiners report has just been released
in the Programme resources for Biology on myIB.
Here is a brief summary of the examiners' findings and suggestions.
Examiner's words in Bold, and my thoughts in normal font.
Examiners saw many standard labs, e.g. enzymes, photosynthesis, osmosis, and seed germination.
Although this in not penalised, it can limit opportunities for students to “explain the reasoning behind the selection of methodological considerations' in the 5/6 mark criterion of RD2 or to, "justify their conclusion within the accepted scientific context” in C2.
Examiners saw very few data based IAs or data from simulations
It seems that generally speaking simulations or data base sources of data rarely score highly and some advice is given to help students improve this type of IA.
- Choose specific, biological variables, as these can be analysed in context of research question and the scientific context.
- Avoid non-biological variables e.g. Human development index. as they are difficult to analyse.
- Give particular attention to the evaluation in this type of study.
- Alway assess the reliability of the data.
Examiners noted that some students still use inappropriate protocols
It's always been recommended to show students the IB sciences experimentation guidelines.
There are two important places to look in this document, Human physiology experiments, and Microbiological studies. There have been some changes in the latest update;
Human physiology experiments,
- Do not use participants under the age of 16 without the written consent of their parents.
- The latest guide does not mention that it is OK to test your own saliva.
- Drinking beverages containing, alcohol or caffeine and energy drinks is not acceptable.
- A physical activity readiness questionnaire (PAR-Q) is recommended before any exercise.
Microbiological studies
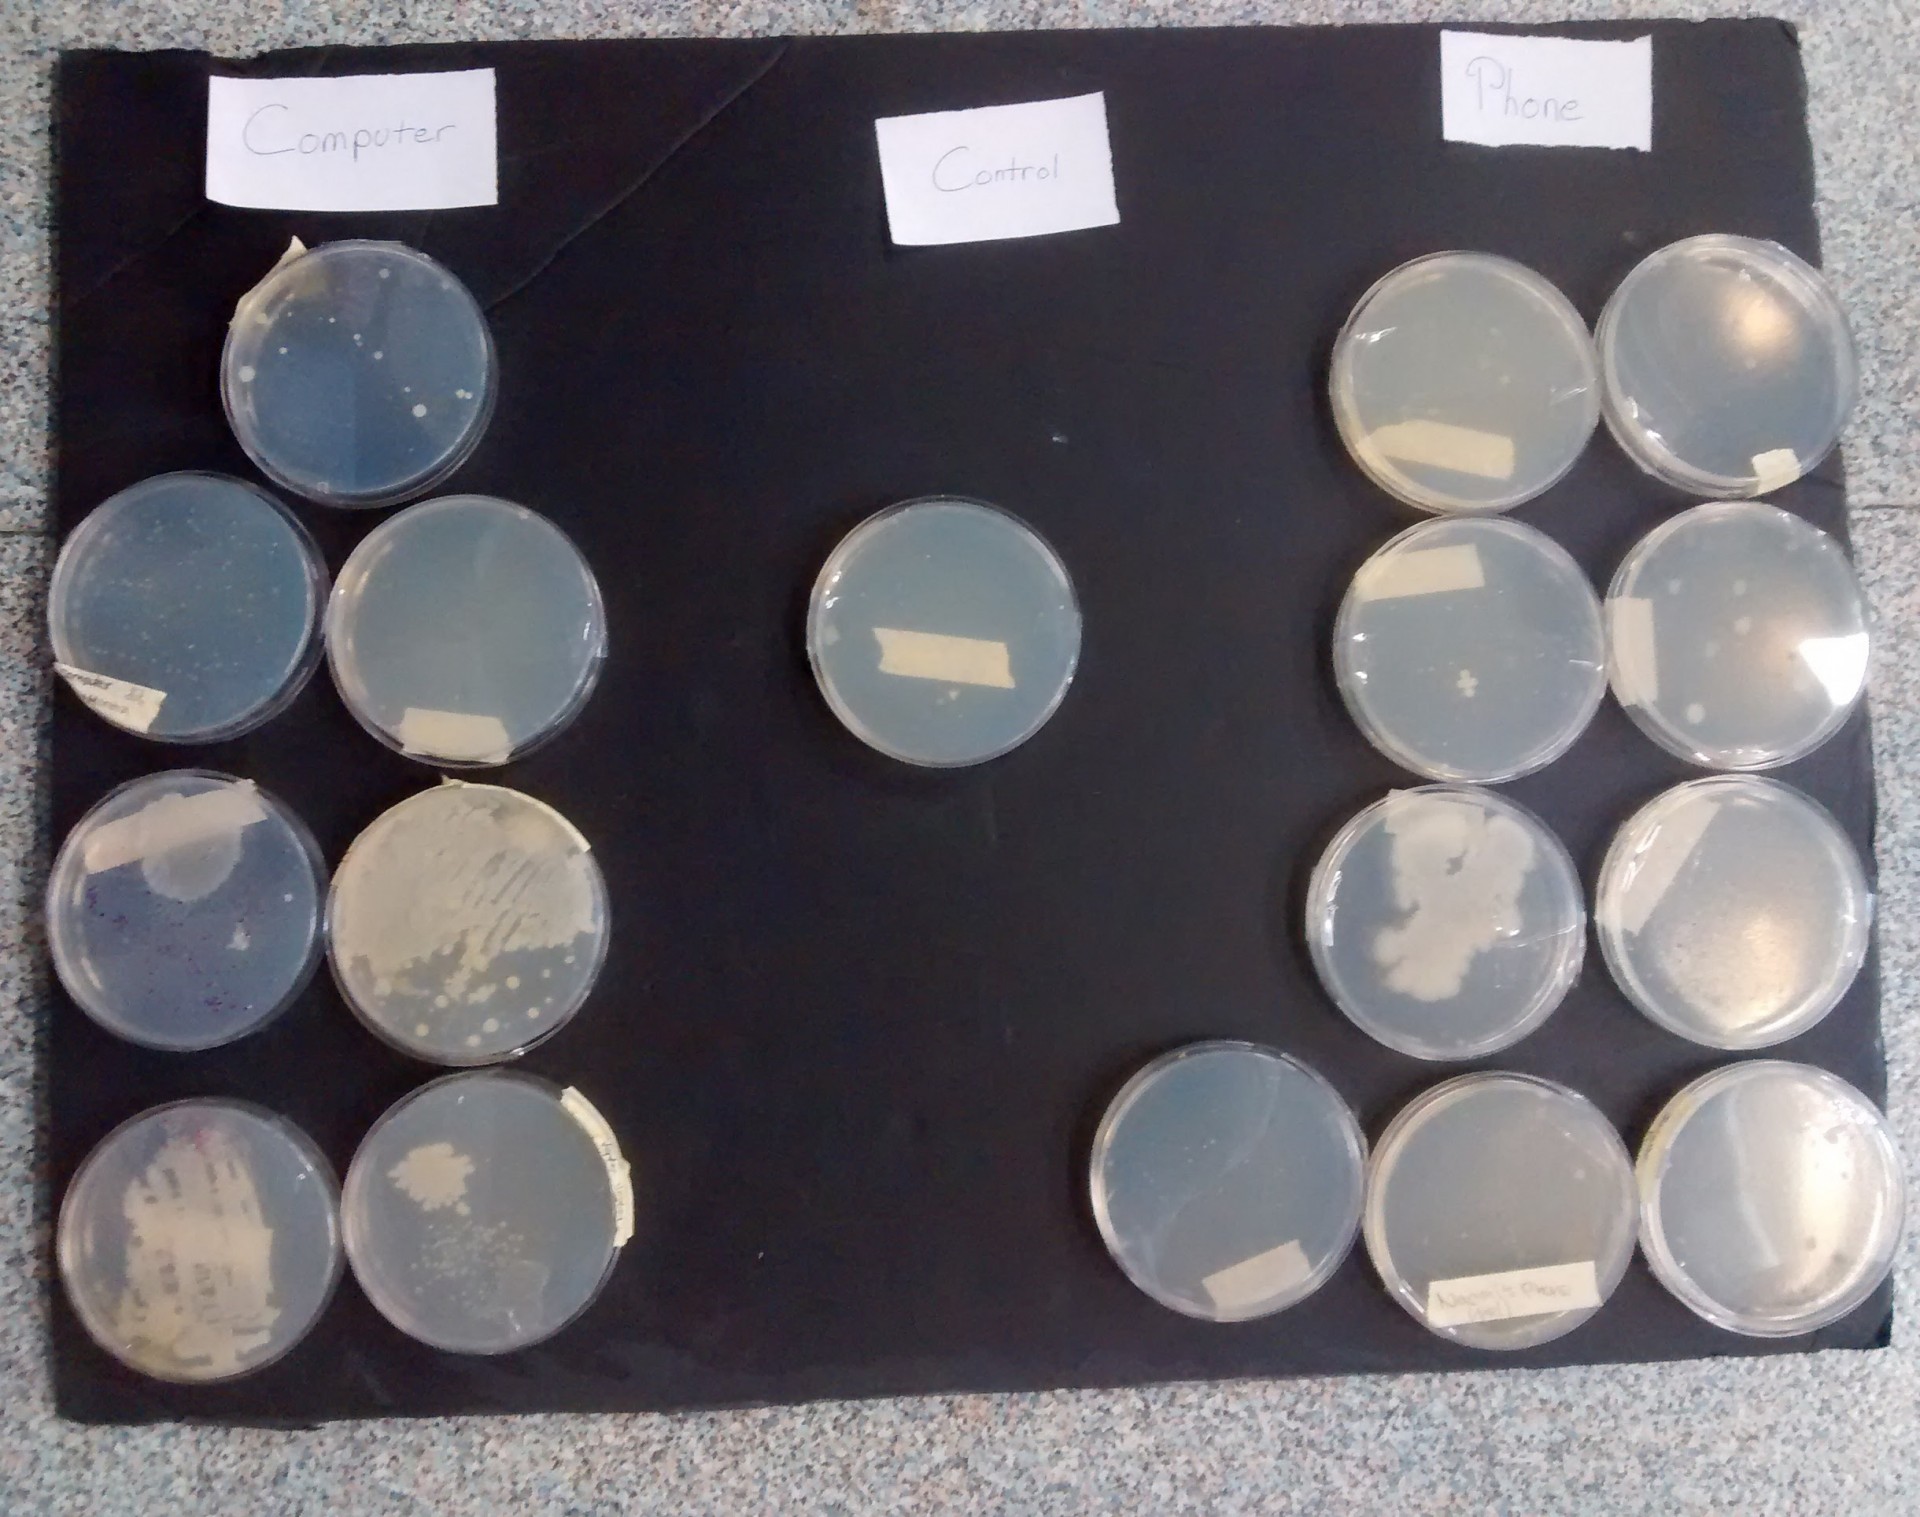
- Bacteria must not be incubated above 25°C.
- Bacteria used should be non-pathogenic and from a known source. (The source should be named)
Examiners noted that teachers did not include detailed comments supporting their own marking
It really helps the moderators to understanding a teacher's awarding of marks, especially specific notes about difficult judgements, E.g. decisions to award 3 rather than 4 in one criterion, but then 4 rather than 3 in the next.
Sections not included in the 3000 word limit
- Charts and diagrams
- Data tables
- Equations, formulas and calculations
- Citations/references (whether parenthetical, numbered, footnotes or endnotes)
- Bibliography
- Headers
- Cover page
- Contents page
- Students were quite good at writing research questions
- As before it is expected to include the range of the IV in the research question
(e.g. “…. the incubation temperature ( 5,10,15,20 or 25°C)?” Note that in the Unpacking the IA document, it suggests that some information can be included in the background, e.g. for a question “What is the effect of X on the rate of Y?”, the rate would be derived from the measured values. The link between the dependent (derived) variable (rate) and the measured values in the investigation would need to be established in the background. - One change to be noted - command terms, state, describe, explain.
This occurs in RD2 methodological considerations, describing controlled variables would be 3/4 explaining them 5/6. We need to look beyond the thoroughness of the considerations, and look for explanations. A good example is a student explaining how the results of their pilot study helped them set the range of the IV. - Many students missed details in the method that would enable it to be considered "repeatable',
Examples:- How the controlled variables are actually controlled in the method.
- “Keep all trials in the same place”, is not enough detail to be considered repeatable without describing how to monitor the controlled variables.
- Describing in the method steps exactly when and how to do repeats.
- Saying exactly how to measure the dependent variable, “measure the length of the seed root”, could have more detail, from where to where, what to do if there are side roots, etc.
- Inconsistent use of units, eg. “mass of salt /g” is not the same as, “concentration of salt / gdm-3 ”
- How to dispose of waste.
- In most cases the raw data was well presented.
- Some students missed headings, units, or uncertainties in table, or the whole raw data table.
Raw data and qualitative observations are expected, with the exception of data logger data. - Communication (with clarity and precision) of data and processing was not always seen by examiners.
Clarity refers to layout of table, column headings, sample calculations, details of processing, screenshots etc.
Precision is about data conventions, SI units, consistent decimal points, graphs and table consistency, uncertainties, error bars, best fit lines etc. - Standard error should only be used in samples >30
Standard deviation can be calculated for >5, or the range for < 5 repeats - If outliers are identified they could be identified statistically - justification of removal of an outlier is needed. Outliers don't have to be removed from the data set.
The statistical test of 1.5 X inter-quartile range from the median is a new addition to the statistical tools. - If the removal of an outlier reduces a sample size to <5 then a standard deviation for this data would be invalid.
For a standard deviation 5 repeat values is the minimum.
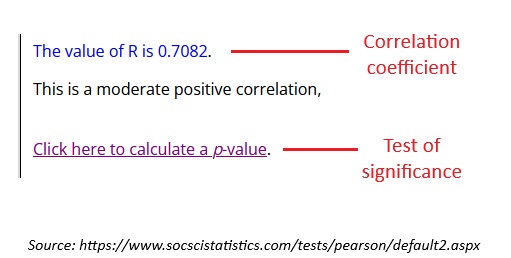
- Correlation coefficients should have an additional statistical test of significance.
Most online correlation coefficient calculators have this as an option, e.g. Socscistatistics.com
- ANOVA tests should have a post hoc test.
The Tukey HSD (honestly significant difference) test is most commonly used.
- Sample calculations are not always given when explaining processing.
It is expected that the processing steps are described, and sample calculations illustrate this well. Screenshots of online calculators or excel formulae are acceptable.
- Statistical tests of significance are often used (good) but the choice of test is not often justified
In the C1 strand the command terms state, describe and justify are used, so students need to go beyond descriptions to get into the 5/6 mark band. - Students should be urged to refer to specific data points, and associated uncertainties.
This is important in any description of data. - References cited were rarely revisited or discussed
The 5/6 mark descriptor says, “makes thorough relevant links to justify the conclusion within the scientific context” so simply saying that "Author X found a similar pattern in their published paper." is really a superficial link. It isn't so difficult to add details about how similar the procedures were, and if the numbers match closely or only in the general trend. Referring to specific data points could help here. - Examiners suggest that in the conclusion students use the biology they have learned to explain the data
Examples include, relating rates of a process to enzymes, the lock and key model, kinetic energy or relating the rate of growth of seeds to the requirements of germination, osmosis, or enzymes.
- Remember strengths are no longer needed in the evaluation.
Students might find online examples from the previous IA structure, and use them to help with structure, or even to copy ideas. The same is true for suggestions of further experimental ideas, which is also no longer required. - Many students described weaknesses, but few got as far as explaining them.
The evaluation section has State, describe, and explain command terms in each mark band. To be safe it may be good to ask students to respond to the prompts;- Say what the weakness is.
- Describe more about the weakness.
- Explain why this is a weakness.
- Students should distinguish between procedural errors (e.g., spills, delays) and methodological limitations (e.g., small sample size, uncontrolled variables)
I think the aim of this is to encourage more breadth in the thinking, it is also possible to add assumptions or the reliability of statistical tests. - Students rarely supported evaluation points with observations from their own data, such as unexpected trends, inconsistent replicates, or outliers.
This is an excellent suggestion, and a practical way to keep limitations realistic and relevant. - Reference to the relative impact of each weakness / limitations is needed for the 5-6 band.
How students work this out must only be qualitative, we don't need to have percentage error calculations as in Chemistry. The expectation, I think, is that students can make statements like, “The uncertainty of the 10ml measuring cylinder used to measure the volume of glucose solution probably had a much smaller effect on the final result of each yeast respiration experiment than my omission to stir the solution thoroughly after adding the granules of yeast.” - The reliability of statistical tests, when sample sizes are just 5, the limitations of the stats should be acknowledged.
Students have probably leaned in maths that sample size is important, and sometimes in Biology we focus on 5 repeats without thinking why. The stats tests we use are not very reliable with just 5 repeats, but as time is limited this is used as the minimum. - Improvements suggested suffered from being vague, inappropriate or unrealistic.
"Collect More data", must be the classic example of this. Students find this difficult because they lack experience of performing biology labs, so they don't know what equipment is available. Many are challenged enough by the statistics, so that asking them to imagine the same calculations with more data is not easy. Perhaps a few exercises during the year to collect different numbers of repeats during simple class labs would help. A nice example could be collecting repeat values in an osmosis lab, and calculating the mean, and standard deviation of different numbers of values. Another might be evaluating the number of quadrats needed in a sample to achieve a reliable estimate of a population or the density off a plant species.
Read the full report yourself here: DP Biology Subject reports