Practising Data & Stats Skills - Phosphorous in Mud (Answers)

This page provides the answers to the activity allowing you to practice your data and statistics skills by graphing and analysing some data on mud. The activity can be found here: Practising Data & Stats Skills - Phosphorous in Mud
Table 1: Data on phosphorus.
| Location | Total Phosphorus (ug P/g dw) | Location | Total Phosphorus |
| Lake 1 | 528 | Wetland 1 | 773 |
| Lake 2 | 523 | Wetland 2 | 1687 |
| Lake 3 | 105 | Wetland 3 | 167 |
| Lake 4 | 25 | Wetland 4 | 459 |
| Lake 5 | 204 | Wetland 5 | 1909 |
| Lake 6 | 556 | Wetland 6 | 443 |
| Lake 7 | 512 | Wetland 7 | 130 |
| Lake 8 | 490 | Wetland 8 | 1574 |
| Lake 9 | 366 | Wetland 9 | 1604 |
| Lake 10 | 177 | Wetland 10 | 1387 |
The data is also available in this SPREADSHEET.
1. To begin to understand what the data reveals in relation to the research question, draw an appropriate graph of the raw data. NOTE: This graph wouldn't necessarily appear in an IA but rather helps you begin to understand your data.
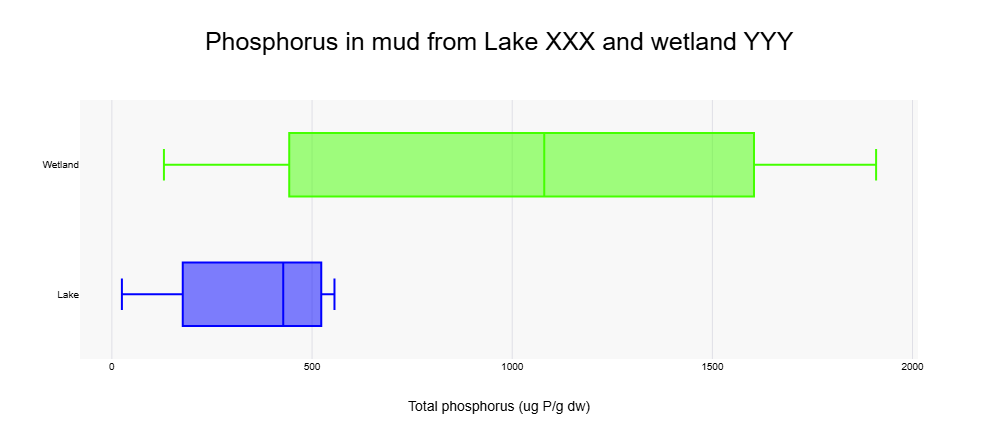
An excellent way to start is to do a box-and-whisker plot. You can use this website: https://www.statskingdom.com/advanced-boxplot-maker.html
2. Explain what your graph reveals about the raw data.
The graph shows that the wetland data has a high level of variability (a wider range) than the lake data.
The median for the wetland data is higher than the lake data.
There are no obvious outliers in the data set.
3. Calculate the mean and standard deviation for each location.
Lake mean = 348.6
Lake std dev = 201.9
Wetland mean = 1013.3
Wetland std dev = 686.8
4. This processed data can be graphed as shown below. Explain what the processed data reveals.
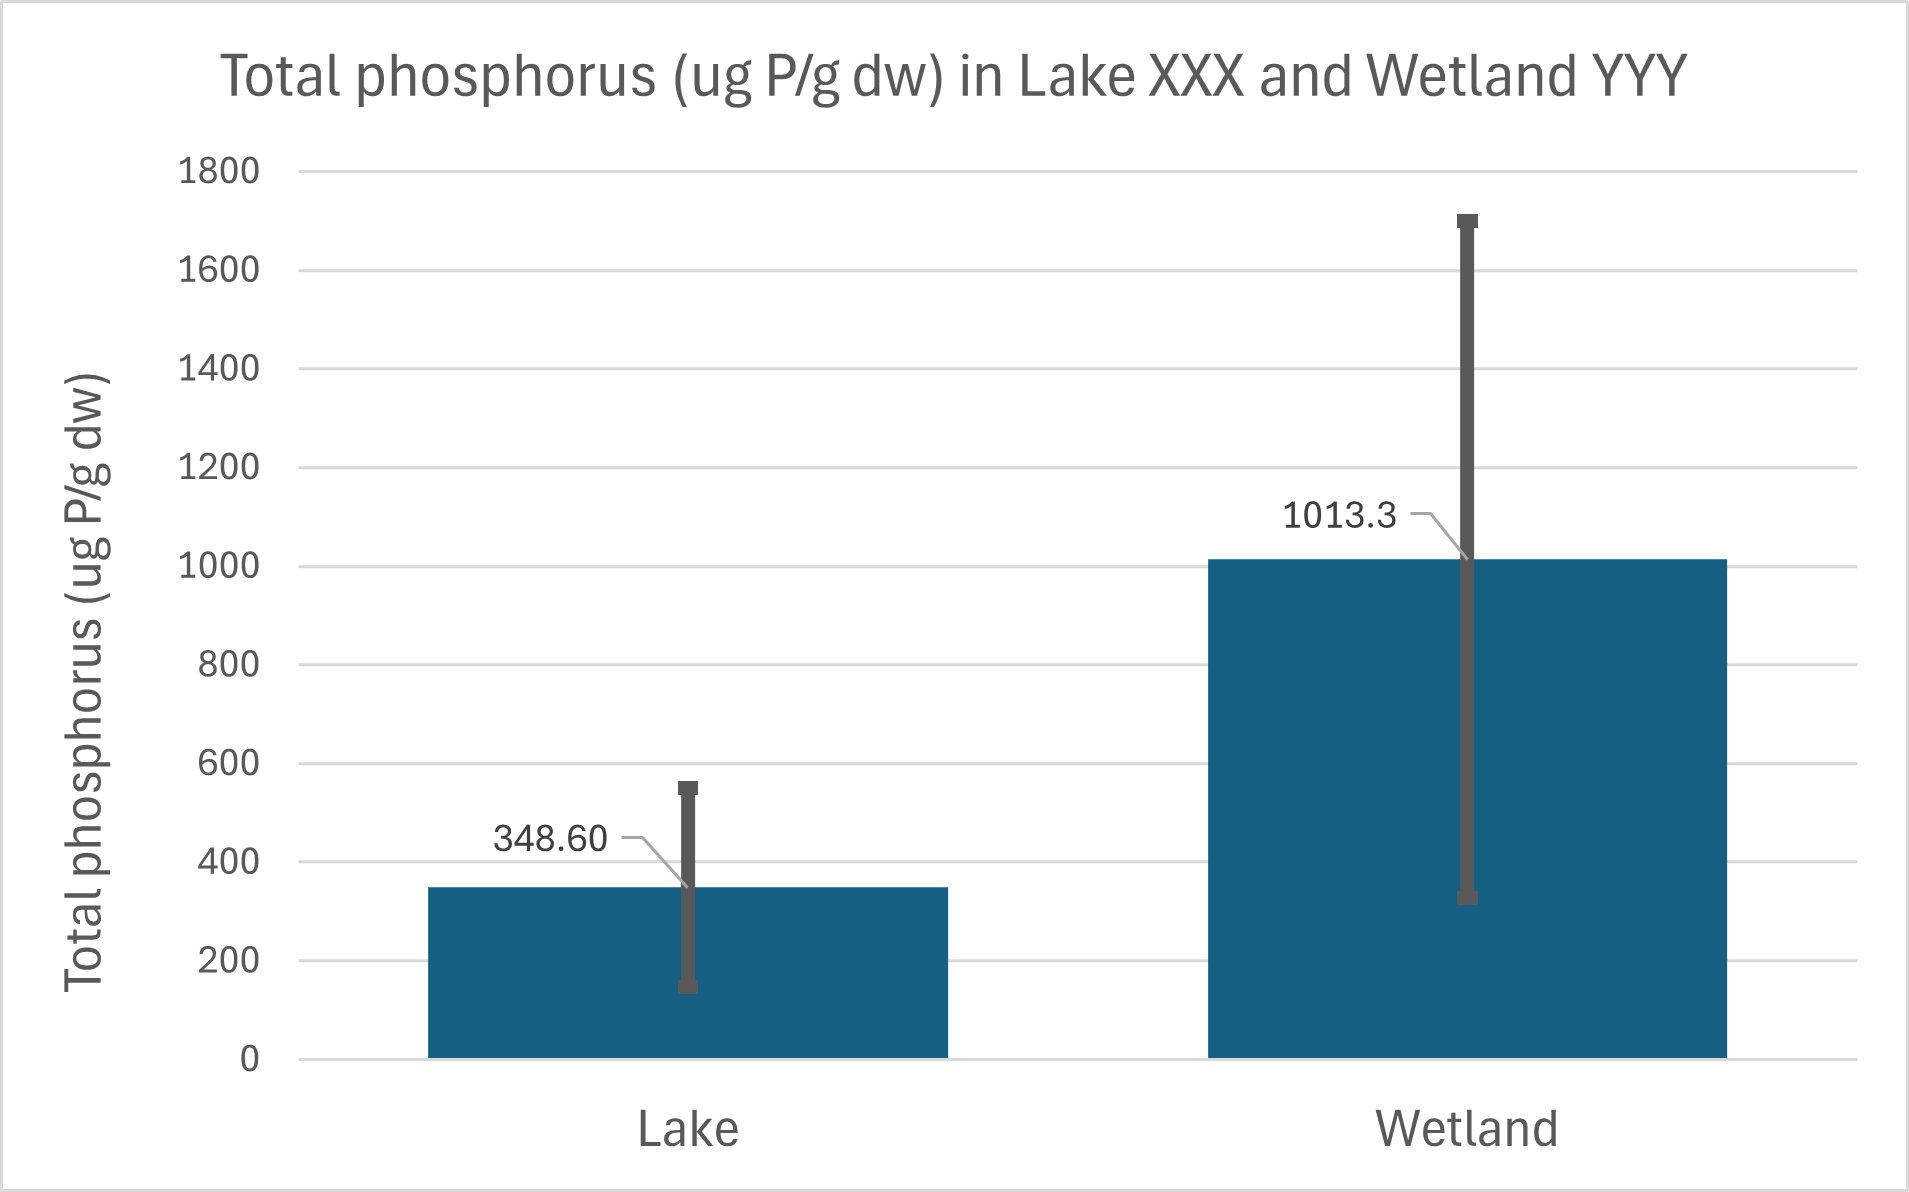
The mean for the wetland data is higher than the lake data.
The standard deviation for the wetland data is higher than the lake data.
There is much overlap between the error bars, perhaps indicating that there is no statistically significant difference between the two locations.
5. Describe how you would proceed from here to analyse the data further. Consider:
- What is the goal − to compare variables or find a relationship between variables?
- What is the most appropriate statistical test?
- What would be the testing hypotheses?
- Carry out the test and write up the results.
The image below may be helpful.

What is the goal − to compare variables or find a relationship between variables?
Our goal is to look for a difference between the wetland and lake data.
What is the most appropriate statistical test?
Our data is continuous - we have measured the phosphorus levels.
If we run both sets of data through a Shapiro-Wilk test we confirm that both sets of data can be assumed to be normally distributed.
Therefore, we can use an independent t-Test to test for a difference.
What would be the testing hypotheses?
H0: The means for the wetland and lake data are equal.
H1: The means for the wetland and lake data are NOT equal
Carry out the test and write up the results.
Using this website and doing a two-tailed test, we get the following results:
The t-value is -2.93605. The p-value is .008829. The result is significant at p < .05.
Therefore, we can write up the result:
An independent t-Test was performed to examine the difference between phosphorus levels in wetland locations and in a lake. The results from the wetland (M=1013.3, SD=686.8) and the lake (M=348.6, SD=201.9) indicate that the phosphorus levels in wetland and lake areas are different, t(18) = -2.94, p = .0088.
This result is statistically significant at a 5% significance level as the calculated p-value is less than 5%.
This means we can be confident that if we repeated the experiment, we would get the same result.
This result indicates that the phosphorus levels in wetland areas and lakes are statistically significantly different... [relate back to RQ]