Practising Data & Stats Skills - Salicylic Acid

This activity allows you to practice your data and statistics skills by graphing and analysing some data on how the concentration of salicylic acid affects plant growth.
This activity is a biology style IA set of data. For an ESS IA, you need an environmental context and so you would need to connect it to a context. Do willow trees leak salicylic acid into the soil − could this be used to help germination in agroforestry, for example?
A student wished to investigate how the concentration of salicylic acid affects the growth of green bean (Phaseolus vulgaris) seeds. She decided to assess this by measuring the length of the shoot growth after 10 days.
Let's look at some (made-up) data that could have come from this study. The data below shows the shoot growth for 15 plants from each of the 5 levels of acid concentration (0.0%, 0.5%, 1.0%, 1.5%, 2.0%).
NOTE: This data was constructed to allow you to do certain data manipulations and statistical tests. It does not necessarily reflect real life.
| --- Sprout length (cm) after 10 days --- | |||||
| Concentration of salicylic acid | |||||
| Plant | 0.0% | 0.5% | 1.0% | 1.5% | 2.0% |
| 1 | 3.2 | 3.8 | 4.9 | 5.6 | 6.9 |
| 2 | 3.6 | 4.1 | 5.2 | 5.9 | 6.3 |
| 3 | 2.8 | 3.8 | 4.7 | 4.9 | 5.7 |
| 4 | 3.1 | 0.0 | 4.8 | 2.9 | 6.0 |
| 5 | 0.0 | 4.5 | 4.5 | 5.2 | 5.8 |
| 6 | 2.5 | 3.9 | 5.2 | 4.9 | 6.3 |
| 7 | 3.8 | 4.8 | 5.3 | 5.7 | 4.2 |
| 8 | 2.9 | 4.1 | 0.0 | 5.6 | 2.4 |
| 9 | 2.1 | 3.7 | 2.6 | 5.1 | 0.0 |
| 10 | 3.8 | 4.0 | 5.8 | 6.1 | 9.0 |
| 11 | 2.8 | 4.5 | 5.6 | 5.8 | 6.4 |
| 12 | 3.2 | 4.3 | 5.4 | 4.8 | 7.1 |
| 13 | 2.7 | 4.2 | 4.9 | 6.2 | 5.4 |
| 14 | 3.1 | 0.0 | 5.6 | 5.9 | 5.0 |
| 15 | 3.2 | 4.5 | 5.5 | 6.1 | 6.8 |
NOTE: This data can also be accessed in this SPREADSHEET.
1. To begin to understand what the data reveals in relation to the research question, draw an appropriate graph of the raw data. NOTE: This graph wouldn't appear in an IA but rather helps you begin to understand your data.
2. Explain what your graph reveals about the raw data.
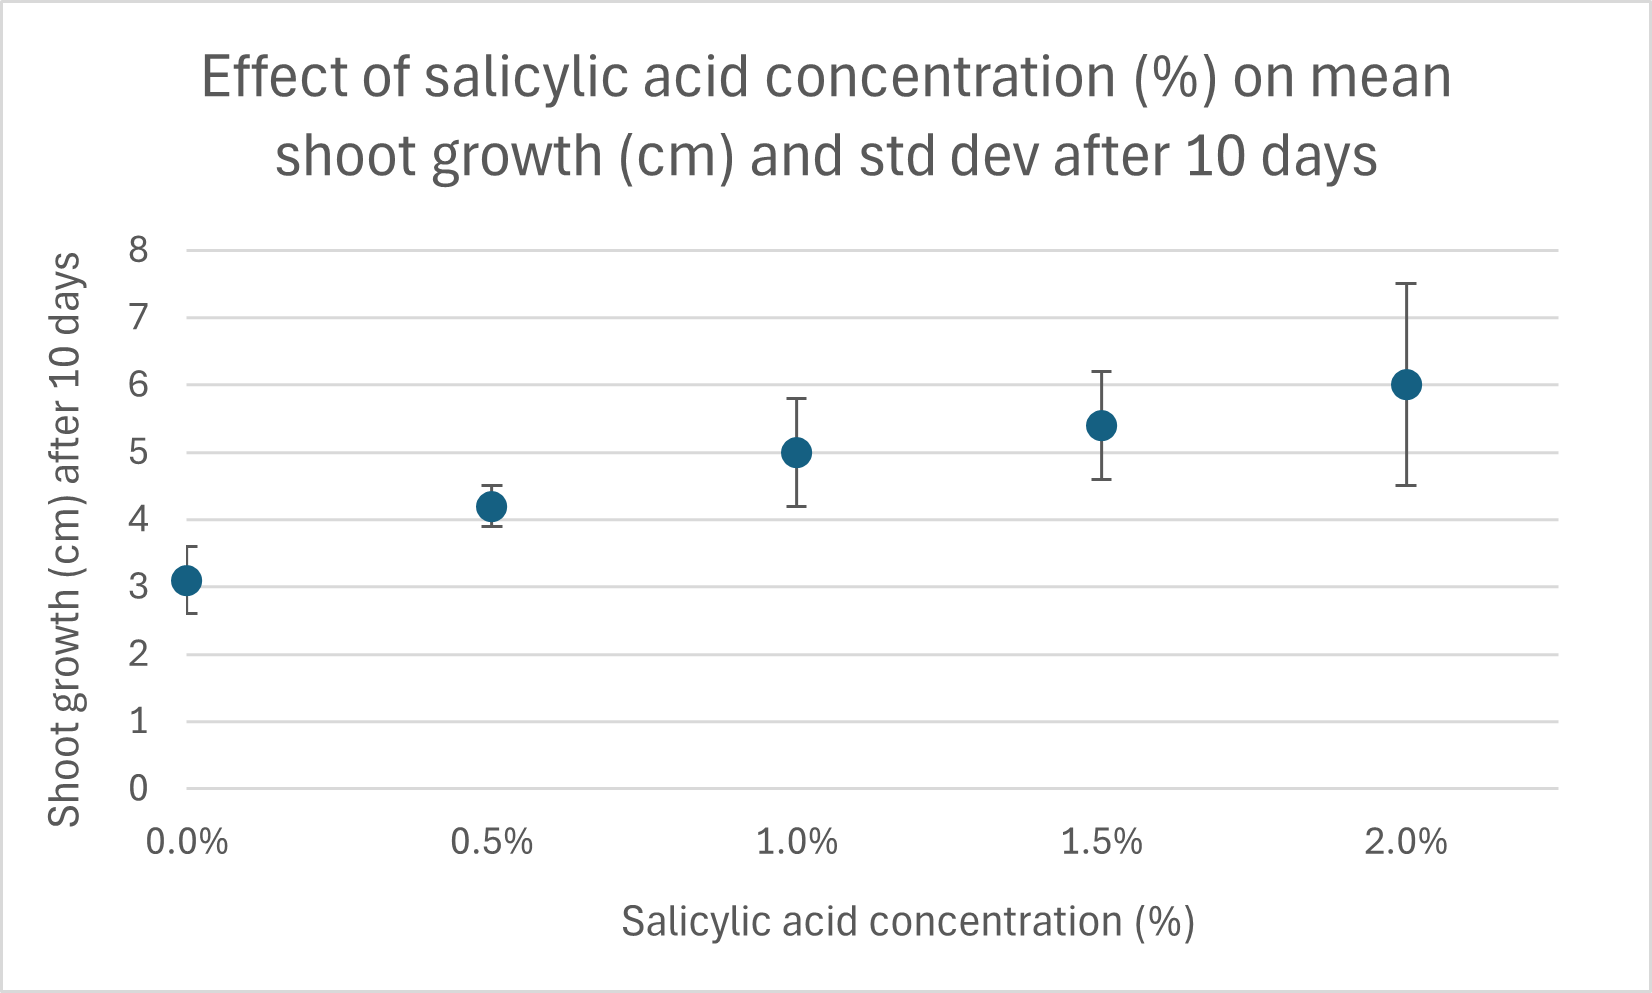
5. Describe how you would proceed from here to analyse the data further. Consider:
- What is the goal − to compare variables or find a relationship between variables?
- What is the most appropriate statistical test?
- What would be the testing hypotheses, if any?
- Carry out the test and write up the results.
The image below may be helpful.
