Practising Data & Stats Skills - Phosphorous in Mud
This activity allows you to practice your data and statistics skills by graphing and analysing some data on mud. Answers can be found here: Practising Data & Stats Skills - Phosphorous in Mud (Answers)
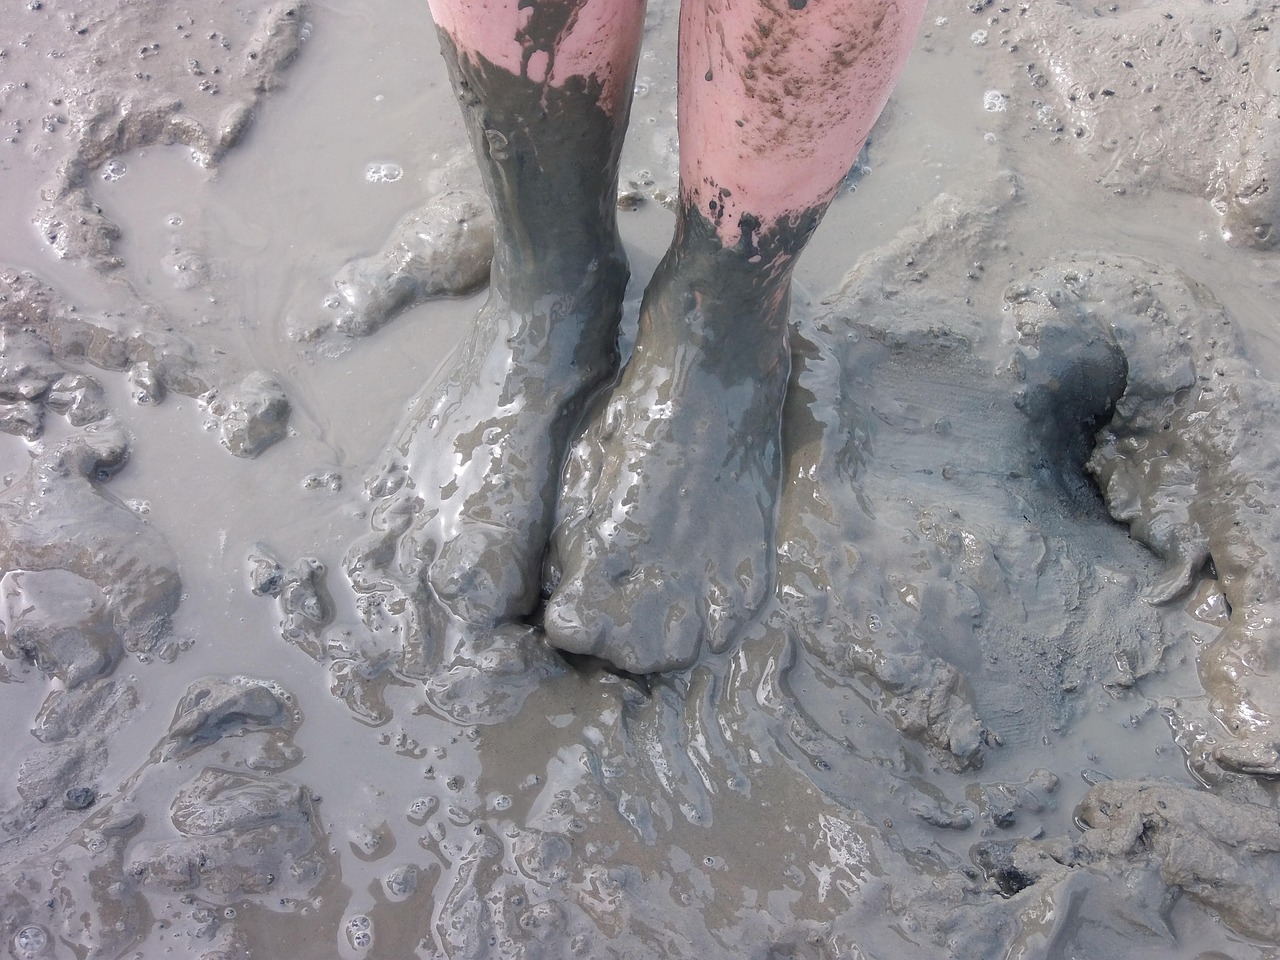
Mud matters! That mucky, (sometimes) stinky stuff is a dynamic environment with two key functions:
- A home for microbes: Mud is teeming with microbes that decompose, or break down, dead plant and animal material to get energy.
- A source of nutrients: It is often rich in the element phosphorus, which acts as a natural fertiliser for plants in the ecosystem.
But no two patches of mud are the same. In this activity, we'll dive into some data to see if there's a difference in the phosphorus levels of mud collected from a lake and a wetland area.
The process was simple: collect the mud, dry it out completely, and then measure the amount of phosphorus. NOTE: Phosphorus is reported in ug P/g d.w. which means “micrograms of Phosphorus per gram of dry weight.”
Table 1: Data on phosphorus collected from a lake (10 different locations) and a wetland area (10 different locations).
| Lake Location | Total Phosphorus (ug P/g dw) | Wetland Location | Total Phosphorus |
| # 1 | 528 | # 1 | 773 |
| # 2 | 523 | # 2 | 1687 |
| # 3 | 105 | # 3 | 167 |
| # 4 | 25 | # 4 | 459 |
| # 5 | 204 | # 5 | 1909 |
| # 6 | 556 | # 6 | 443 |
| # 7 | 512 | # 7 | 130 |
| # 8 | 490 | # 8 | 1574 |
| # 9 | 366 | # 9 | 1604 |
| # 10 | 177 | # 10 | 1387 |
The data is also available in this SPREADSHEET.
NOTE: Ideally you would have more data than given here. This data set has been chosen to allow you to practice calculations easily.
1. To begin to understand what the data reveals in relation to the research question, draw an appropriate graph of the raw data. NOTE: This graph wouldn't necessarily appear in an IA but rather helps you begin to understand your data.
2. Explain what your graph reveals about the raw data.
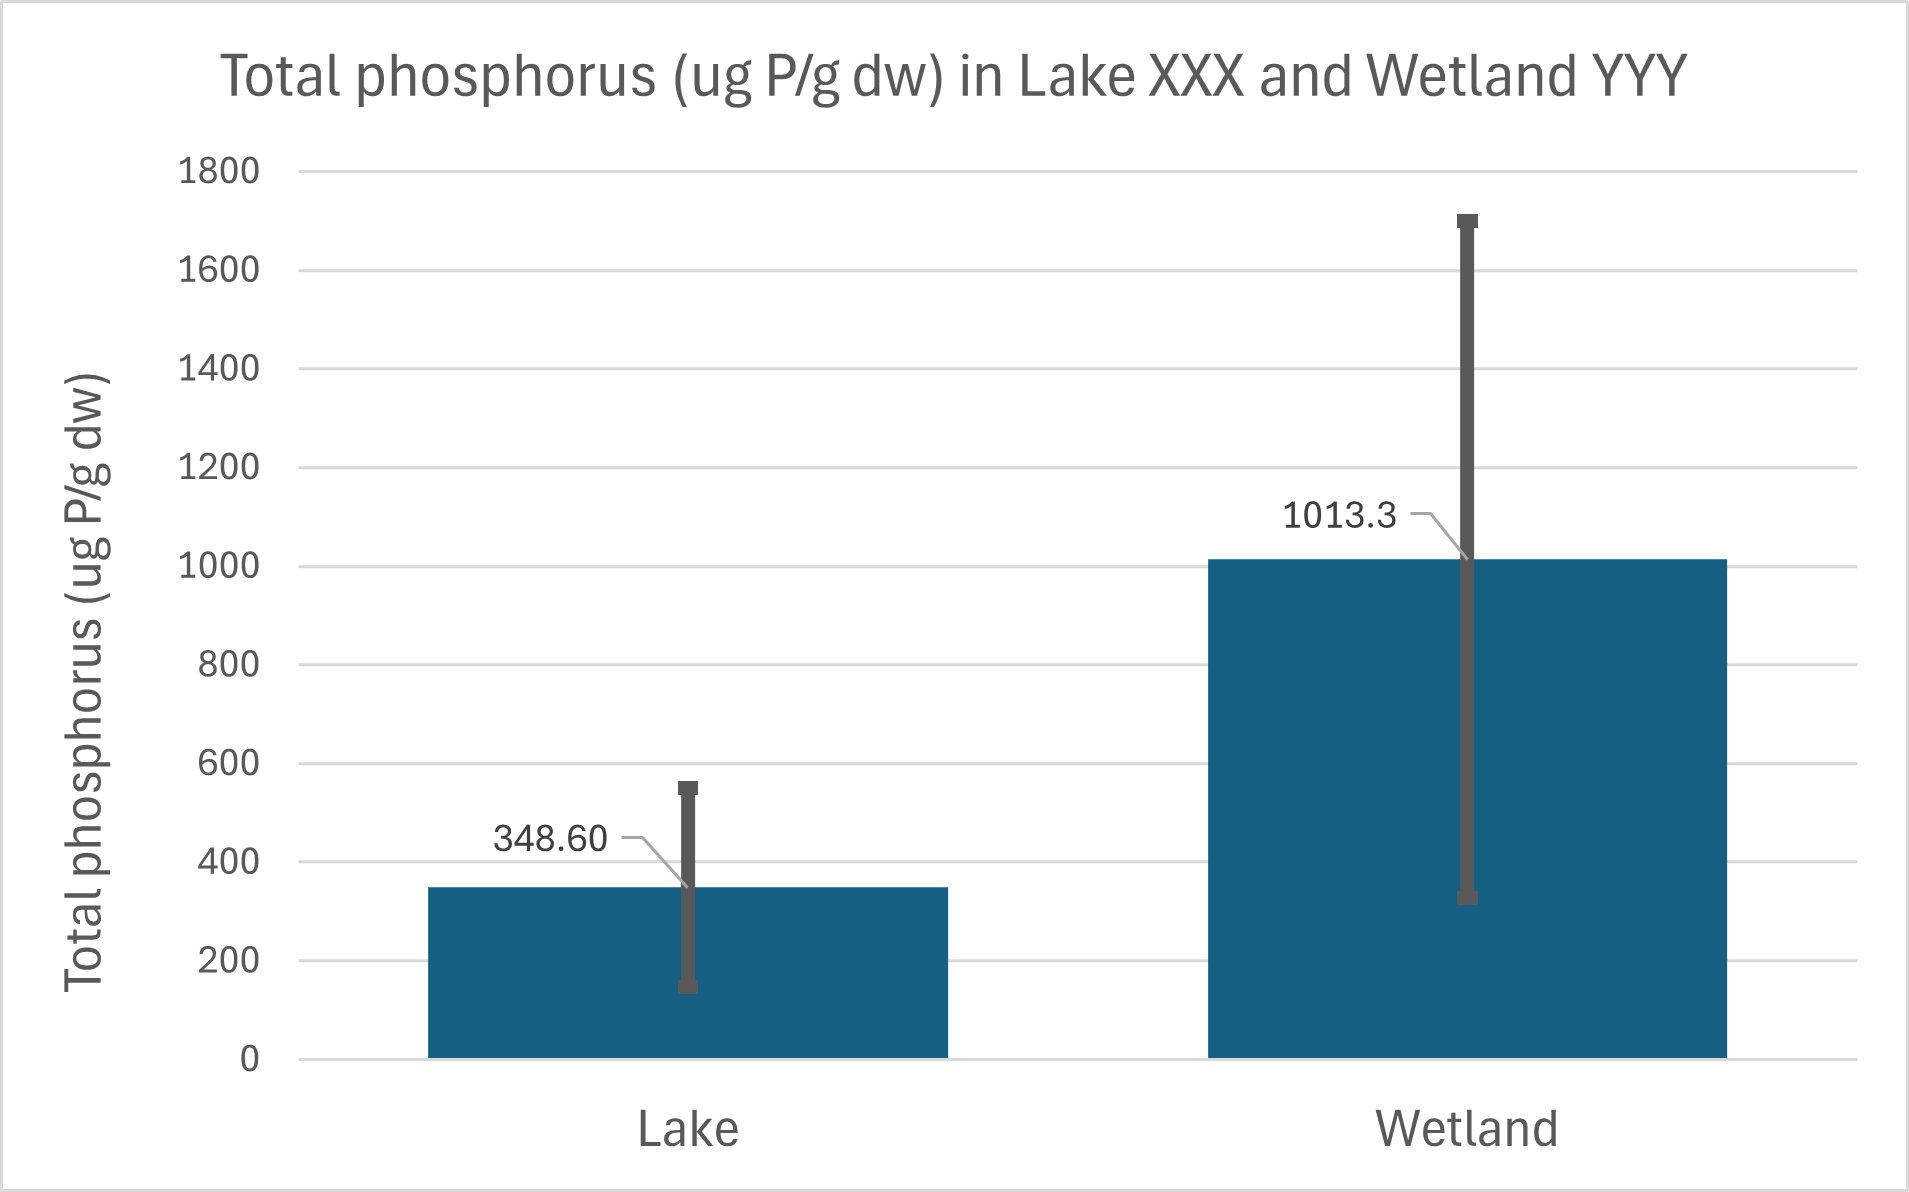
5. Describe how you would proceed from here to analyse the data further. Consider:
- What is the goal − to compare variables or find a relationship between variables?
- What is the most appropriate statistical test?
- What would be the testing hypotheses?
- Carry out the test and write up the results.
The image below may be helpful.
