Practising Data & Stats Skills - Microplastics in the Oceans
This activity allows you to practice your data and statistics skills by graphing and analysing some data on microplastics in the oceans.
A student wished to investigate how the density of microplastics varies between the Pacific and Atlantic Oceans. She decided to source secondary data using the NCEI Marine Microplastics database which provides aggregated global data on microplastics in marine settings. See the website Marine Microplastics for the database.
The method of extracting the data is set out on Microplastics Data Analysis − you could follow this procedure and source your own data set.
The first 100 data points were chosen for each ocean from the total data collected from 2019-2022, thus ensuring a "random" selection of data. The sampling method was the Manta Net.
The data is available in this SPREADSHEET.
1. To begin to understand what the data reveals in relation to the research question, draw an appropriate graph of the raw data. NOTE: This graph wouldn't appear in an IA but rather helps you begin to understand your data.
2. Explain what your graph reveals about the raw data.
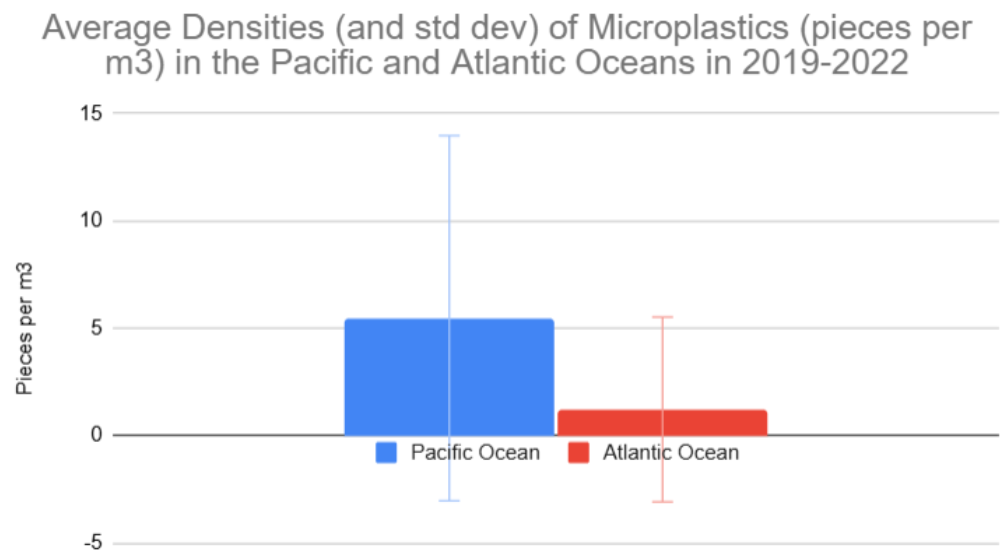
5. Describe how you would proceed from here to analyse the data further. Consider:
- What is the goal − to compare variables or find a relationship between variables?
- What is the most appropriate statistical test?
- What would be the testing hypotheses?
- Carry out the test and write up the results.
The image below may be helpful.
