Practising Data & Stats Skills - Recycling (Answers)
This page provides answers to the activity allowing you to practice your data and statistics skills by graphing and analysing some data on recycling habits.
1. Draw an appropriate graph of the raw data.
It would be possible to draw two pie charts (one for each gender) but this makes any comparison between genders quite difficult.
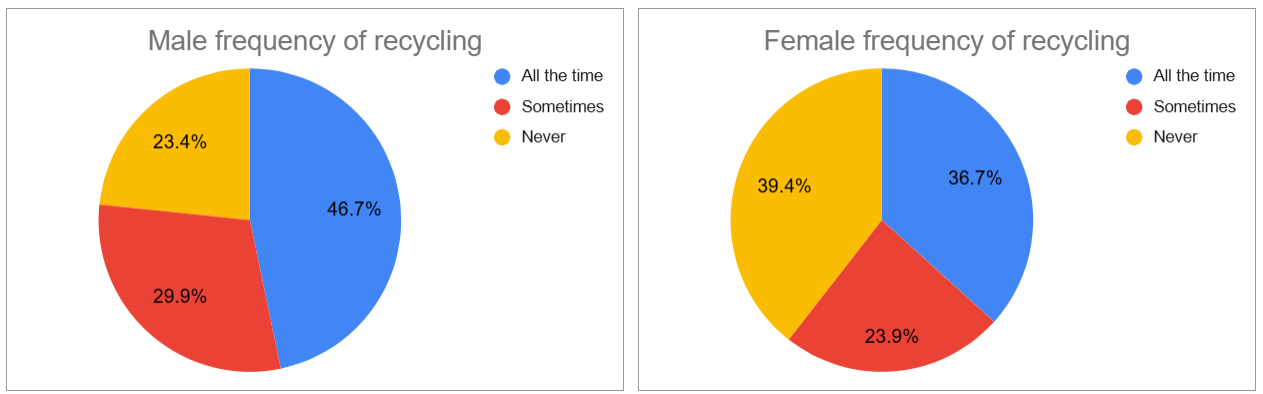
The best option is to draw a stacked bar chart. This allows easy comparison between the two gender groups.
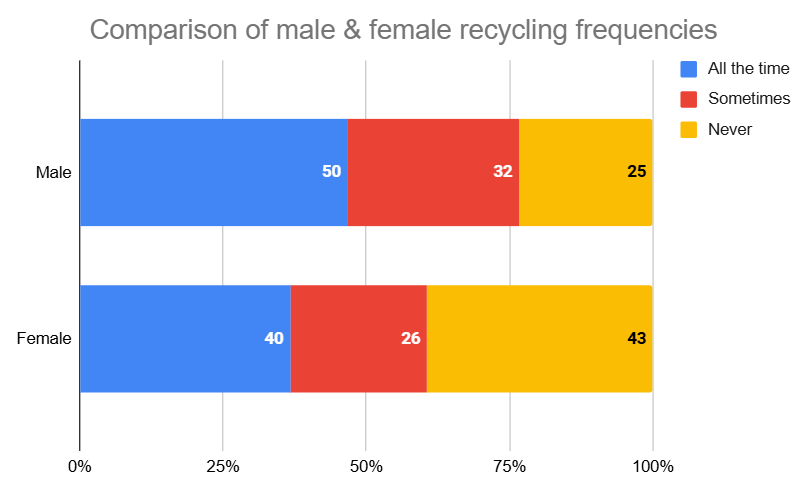
2. Explain what your graph reveals about the raw data.
We can see from the graph:
- Males are more likely to recycle than females.
- Around 25% of males never recycle, but around 40% of females never do.
- There seems to be a difference between genders.
3. Describe how you would proceed from here to analyse the data further. Consider:
- What is the goal − to compare variables or find a relationship between variables?
- What is the most appropriate statistical test?
- What would be the testing hypotheses?
- Carry out the test and write up the results.
The next step would be to use appropriate statistical tests to test whether there is a significant difference between males and females.
We are looking for a difference and we have categorical data.
The Chi-square test for independence looks for an association between two categorical variables within the same population. So this would be the most appropriate test.
The hypotheses for the test are:
H0: Recycling is independent of gender.
H1: Recycling is dependent on gender.
We suggest using this online calculator.
NOTE: "Gender" is our two groups and "frequency of recycling" is our categories for the online calculator.
Using the online calculator, we get a calculated p-value for this test of 0.039. Since this is less than the critical probability or significance level of 5% (P = 0.05), we reject H0.
Therefore, we reject the null hypothesis and conclude that there is evidence that people’s recycling habits are related to their gender.
We would write up this analysis as follows:
A chi-square test of independence was performed to examine the relation between gender and the frequency of recycling aluminium cans. The results are χ2 (N = 2) = , p = .039 at the 5% significance level.
This result is statistically significant as the calculated p-value is less than 5%.
This means we can be 95% confident that if we repeated the experiment, we would get the same result.
This result indicates that we can conclude that there is evidence that people’s recycling habits are related to their gender. [Now relate this back to your research question…]