Practising Data & Stats Skills - Microplastics in the Oceans (Answers)

This page provides the answers for the activity allowing you to practice your data and statistics skills by graphing and analysing some data on microplastics in the oceans.
1. Draw an appropriate graph of the raw data.
The goal is to depict your data visually so you can see what it is revealing about each ocean. It is VERY hard to see this when your data is just numbers in a table.
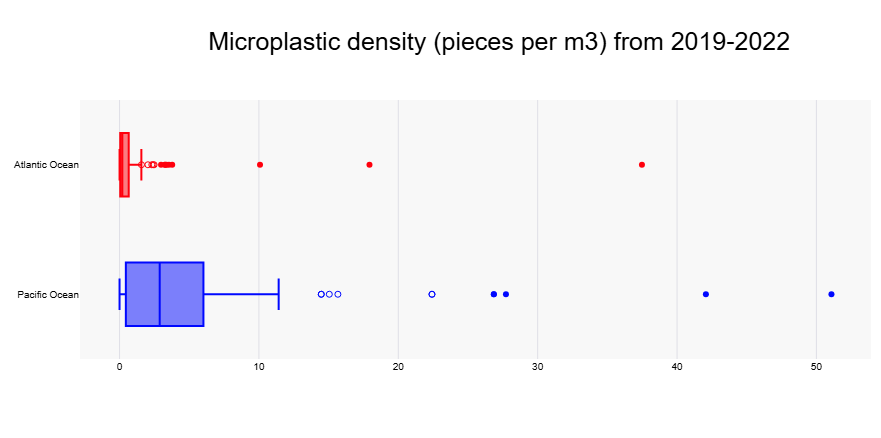
What we really need to show is the spread of our data. One option is to use a box-and-whisker graph as shown below. This highlights that we have some potential outliers. We would need to consider whether these extreme values are outside the bounds of reasonableness.
This was made using this online box plot maker.
2. Explain what your graph reveals about the raw data.
The graph seems to show that the densities in the Pacific Ocean are − on average − higher than in the Atlantic Ocean.
We can also see that there appear to be outliers in both oceans. However, variation in density is not unexpected as the the data is collected from the whole ocean.
3. Calculate the mean and standard deviation for each concentration group.
| Mean | Standard deviation | |
| Pacific Ocean | 5.47 | 8.5 |
| Atlantic Ocean | 1.22 | 4.3 |
4. This processed data can be graphed as shown below.
(a) Identify any problems with this graph.
(b) Propose a better graph.
(b) Explain what the processed data reveals.
(a) The graph doesn't make sense - the error bars go below zero. So we can't present our data like this.
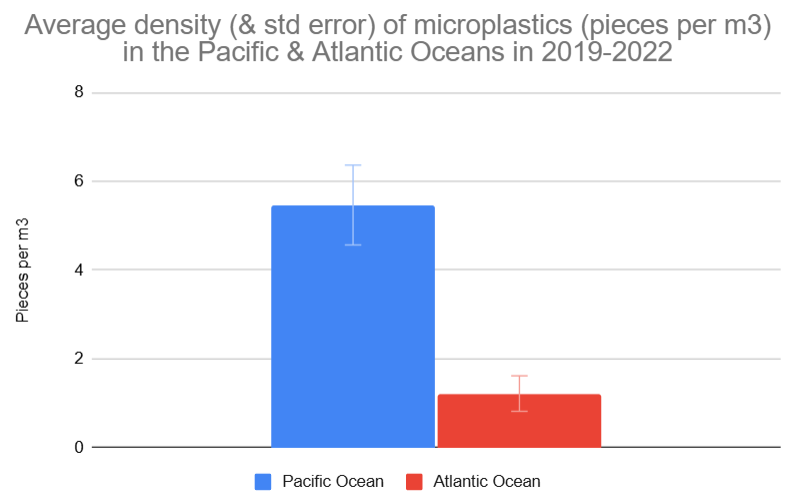
(b) We should graph mean and standard error (rather than standard deviation). Standard error is calculated as standard deviation divided by the square root of the sample size (which is 100 here). This would give the graph below which would be suitable for an IA.
(c) The processed data reveals:
- The mean density in the Pacific Ocean is higher than in the Atlantic Ocean.
- The standard deviation of the density in the Pacific Ocean is greater than in the Atlantic Ocean.
- We should continue to investigate whether the difference between these two oceans is statistically significant.
5. Describe how you would proceed from here to analyse the data further. Consider:
- What is the goal − to compare variables or find a relationship between variables?
- What is the most appropriate statistical test?
- What would be the testing hypotheses?
- Carry out the test and write up the results.
The next step would be to investigate whether there is a statistically significant difference between the two oceans.
We would start by checking whether our data sets can be assumed to be normally distributed. We do this by running a Shapiro-Wilk Test on each data set. Our suggested online calculator for this is HERE.
Running the data through gives the following results:
Pacific Ocean: a significant departure from normality, W(100) = .63, p < .001
Atlantic Ocean: a significant departure from normality, W(100) = .27, p < .001
Therefore we cannot use a t-Test, but rather must use a Mann-Whitney Test.
Our suggested online calculator for this is HERE.
Our hypotheses would be:
H0: There is no difference in the distributions of the densities in the two oceans (ie the medians are equal).
H1: There is a difference in the distributions of the densities in the two oceans (ie the median density in the Pacific Ocean is higher than the median density in the Atlantic Ocean).
We will use a one-tailed test as we are interested in testing whether the density in the Pacific Ocean is greater than the Atlantic Ocean.
Running the data through gives the following results:
The p-value is < .00001. The result is significant at p < .05.
Therefore we reject the null hypothesis and can conclude that the median density in the Pacific Ocean is higher than the median density in the Atlantic Ocean.
We would write up our analysis as follows:
A Mann-Whitney Test was performed to compare the median density of microplastics in the Pacific Ocean with that of the Atlantic Ocean. The median density for the Pacific Ocean was 2.88 compared to 0.20 for the Atlantic Ocean. The test results are z = 7.12, p < .000 at a 5% significance level.
This result is statistically significant as the calculated p-value is less than 5%.
This means we can be 95% confident that if we repeated the experiment, we would get the same result.
This result indicates that we can conclude that the median density of microplastics in the Pacific Ocean is higher than the median density in the Atlantic Ocean. [Now relate this back to your research question…]