Home of real teaching & learning
  • Full support for teachers
  • Focus on critical thinking
  • Engaging classroom activities
  • Integrated student eBook
  • Assessed tasks / qBank
  • Practice exam questions

The InThinking Guarantee: Our sites are written by expert practitioners and not by AI

See our AI policy

Disclaimer: InThinking subject sites are neither endorsed by nor connected with the International Baccalaureate Organisation.

Don't miss out, find out!

4.3 Motion

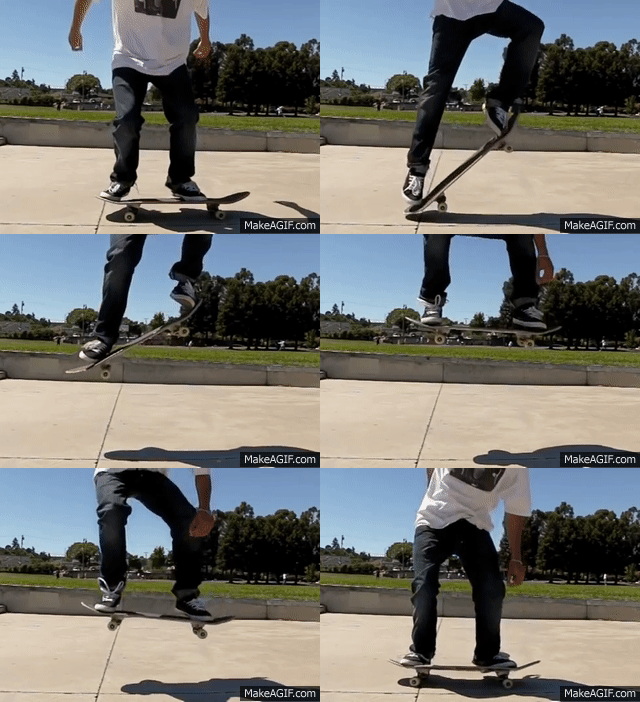
Skateboarder gif from Physics Stack Exchange https://i.sstatic.net/0g7Jt.gif

In this unit students learn about the way that position and movement in space are represented. distance, displacement, speed, velocity, acceleration, motion graphs.

Conceptual inquiry

Our scientific understanding of motion has brought people closer together, bringing new opportunities and challenges

Disciplinary concepts: movement

Transferable conceptual understanding: Change: development and progress bring both improvement and new challenges

Global context exploration

Global context:

Orientation in Space and Time - what is the meaning of "where" and "when"?

Contextual inquiry questions

Individual:

Local: How is traffic managed in my locality? How safe are my streets?

Global: What is the impact of traffic worldwide?

Inquiry questions

Factual: How do we know our location? How do we know where we are going? How do we know how fast we are going? How do we represent change in motion? What happens when an object falls?

Conceptual: How does direction make a difference? How can we represent motion in a graph? How can we understand how distance, velocity and acceleration affect each other?

Debatable: Is it better to always know where you are? What new challenges does greater freedom of movement bring?

Mapping assessment
Assessment objectiveFormative check for understandingSummative tasks
A Knowing and Understanding

A How far?

A Hare and Tortoise accelerated

A Journey graphs 

A Bolt vs car

4.3.6 Motion assessment

 
B Inquiring and Designing  
C Processing and Evaluating

C Around the World

C Hare and Tortoise

C Runner vs rider 

C Jump from space

C CSI Crash Scene Investigation

C Too much traffic?

D Reflecting on the Impacts of Science D Keeping motion safe 
Learning objectives
Students will knowStudents will doStudents will reflect and connect

Define distance as a scalar measurement of the space between two points

Define displacement as a vector between two points in space

Calculate displacements between points 

Learning engagements

4.3.1 How far, which way? in the student e-course introduces (or consolidates) understanding of distance as scalar and displacement as vector quantities

A How far? asks students to interpret smart watch GPS data to determine distances and displacements.

Learning objectives
Students will knowStudents will doStudents will reflect and connect

Define speed as a scalar and velocity as a vector

Define acceleration a=\frac{\Delta v}{\Delta t}

Calculate speedv=\frac{s}{t}and velocity \vec{v}=\frac{\vec{s}}{t}

Calculate accelerations using a=\frac{\Delta v}{\Delta t}=\frac{v-u}{t}

Determine when negative acceleration indicates a change in velocity and distinguish from a reduction in speed

Determine the motion of a body from graphs of distance-time and speed-time


Learning engagements

4.3.2 How fast, how much faster? in the student e-course introduces concepts of speed, velocity and acceleration.

C Hare and Tortoise introduces speed and velocity, using journey graphs.

C Runner vs rider is an alternative, more scaffolded version of a task involving interpretation of distance-time graphs.

Teacher notes

This activity applies existing knowledge of speed, distance and time to a new situation with a ‘Hare and Tortoise’ race. It also provides plenty of opportunity for collaboration skills, as the process for capturing the times of the ‘racers’ at different points on the track requires close teamwork. The task can be assessed summatively for objective C: Processing and Evaluating because students are collecting data, organising it, transforming it into journey graphs and then interpreting it and drawing conclusions. They must then discuss the way the data tests their hypothesis about who will ‘win’ the race, and evaluate their method for charting the journeys of each racer. The final question in the ‘Evaluation’ session prompts students to consider what would happen if we progressively decreased the measurement intervals – and how this would affect the speed-time graph. This might lead some to the idea that we would obtain an increasingly ‘smooth’ curve with more and more points – and some might extend this to the idea of infinitesimal intervals, and so the basis of calculus. Another extension would be to vary the starting times for the ‘hare’ and the ‘tortoise’ and ask students to make predictions about who would win.

Engage: ask students if they know the story of the Hare and the Tortoise?

Discuss activity – ask a student to walk across the classroom / along a corridor, making one step every second, while the rest of the class counts out / claps out the time in seconds.

What is the distance travelled by the student? How much time did they take?

Introduce the equation:

Speed (m/s) = distance (m) / time (s) v=\frac{s}{t}, \vec{v}=\frac{\vec{s}}{t}

Discuss units m/s

Show students how to convert m/s to km/h

Explain and distinguish between speed and velocity

A Hare and Tortoise accelerated can then be used to consolidate understanding of speed and acceleration, and to introduce journey graphs.

Teacher notes

Engage: Repeat the demonstration with a student walking along a corridor, but this time they must make one more step per second than previously, so in first second = 1 step, second second = 2 steps, etc.

Discuss: what is happening to their motion? Introduce the concept of acceleration.

Ask students to suggest how we can modify our speed equation to represent acceleration.

Show students equation acceleration (m/s2) = change of speed (m/s) / time taken (s)

Discuss unit m/s2 as ‘metres per second every second.’

Individually: students review their report from ‘Hare and Tortoise’ and add extension report as given on activity sheet.

This activity extends the analysis of the data from the sprint and jog activity to apply the new concept of acceleration. The activity is suitable for assessment of objective A: Knowing and Understanding since students must state and explain how they identify accelerations from the speed-time graphs (strand i), apply their knowledge and understanding to both identify zero acceleration and to calculate out maximum accelerations (strand ii), then to make a scientific judgement about the significance of a negative acceleration on the graphs.

To consolidate learning and check for understanding, A How far? section A requires students to apply concepts of distance, displacement, speed, velocity and acceleration to real-life GPS tracking data.

Learning objectives
Students will knowStudents will doStudents will reflect and connect
 Plot graphs, transform and interpret data graphically to determine distance travelled, speeds and accelerations 

Learning engagements

4.3.3 Charting motion in the student e-course can be used to support learning for these activities.

The following activities all develop conceptual understanding of the quantities of motion, and plotting and interpreting journey graphs.

A Journey graphs uses the PhET ‘Running man’ simulation to make the connection between velocity, acceleration and motion graphs visual.

C Around the World

Teacher notes

This activity is suitable for formative assessment of objective C: Processing and Evaluating because students have to collect data using online route planning / mapping tools, organise and transform it into a journey graph (strand i), then interpret the journey graph to make deductions about distance travelled and time taken (strand ii). There is also an evaluative element in the last question which encourages them to think about their choice of journey graph to represent the data, although as they are not evaluating a hypothesis or method as such this is not adequate to meet strand iii.

Learning objectives
Students will knowStudents will doStudents will reflect and connect
 

Describe the motion of a body in free-fall

Some students could…

Apply equations for s, u, v, a, t to solve problems


Learning engagements

4.3.4 Falling down in the student e-course can be used to support learning for these activities.

C Jump from space 

Teacher notes

This activity uses the real-life data stream from Felix Baumgartner's 2021 parachute jump from the stratosphere. While Alan Eustace's subsequent jump in 2014 broke Baumgartner's altitude record, the online data stream (courtesy of Red Bull Stratos) provides authentic data for students to record and then interpret. The activity also provides a conceptual bridge to the idea of forces on a body in free-fall, which we return to in the next topic 4.4 Force and Mass. 

Challenge and extend 

There is an extension question in the task C Jump from space.

Students are introduced to suvat equations at the end of this page. My Geogebra applet here intends to help them to visualise the effect of acceleration on distance/displacement and speed/velocity. There is also a video demonstration of the applet here.

A Bolt vs car

Teacher notes

This activity consolidates conceptual understanding of the quantities of motion by transferring and applying in a new context. It also builds on the spreadsheet skills introduced earlier.

In order to complete the task, students must deduce the spreadsheet formulae to use for calculation of the instantaneous speeds and accelerations at each point in the ‘race.’ A Bolt vs car ATTL gives a rubric for teachers to use, and a spreadsheet solution is available: [.xlsx format] [.ods format]

Learning objectives
Students will knowStudents will doStudents will reflect and connect
  

Evaluate local traffic control measures for their efficacy in managing environmental impact and risk

Evaluate the global impact of globalised transportation

Learning engagements / summative assessment tasks

C CSI Crash Scene Investigation

Teacher notes

The 'crime-scene investigation' scenario invites students to do some rich critical thinking using scientific evidence. In this activity they also have to compare the empirical evidence (from the oil drops) to the witness testimony. There is a lot of evidence to first of all assimilate and organise - such as the information about the speed limit, about the rate drips from Mr B's oil leak, along with measurements of distance from the drops traced on the road.Interpretation of the data here takes place at multiple levels. First and foremost, students need to interpret the data about distance to make a judgement about the physical position of the cars. Then in strand (iii), in order to evaluate the validity of the hypotheses made by Ms A and Mr B - that is, their respective claims about speeding - students need to calculate or graphically derive speeds from the distance-time data - in doing so, they are working to interpret data in strand (ii). Finally, in strands (iv) and (v) they need to critically evaluate some assumptions about the relative sizes of the cars, how far Ms A was likely to have stopped in front of the stop light, etc.

C Too much traffic?

Teacher notes

This task provides scaffolding (a writing frame) for students to design an experiment to measure traffic speeds in their locale, perhaps near to a traffic-calming measure such as a speed limit sign. The intention here is to begin to support students' acquisition of experimental inquiry skills for criterion B in the next unit.

If there is no suitable location nearby, or conditions outside school are not suitable for this kind of fieldwork, then there is a spreadsheet model [.xlsx] [.ods].

The data values sheet contains two tables of data by default. The data is 'rigged' such that the traffic  behaves as one would expect when confronting a speed restriction of some kind, ie. it slows from an initial velocity u which is randomised around two different target values. However the extent to which the traffic slows, and whether or not it then accelerates again, depends on random number generators.

The table is laid out such that distance values remain the same, in order to model the data that would be gathered if the traffic speeds experiment procedure were followed.

If used with students, teachers may wish to 'hide' the columns that calculate out speed and accelerationm leaving only the time data, as in the experiment. Possibly these could then be 'unhid' at the end of the analysis so that students can evaluate their own calculations.

The graphs then show distance vs time and speed vs time for each case; again teachers may wish to hide these when presenting the data. Alternatively, the graphs themselves can be used for problem solving as exercises in their own right.

D Keeping motion safe invites students to investigate the impact of vehicle safety design features, in the form of a report for a consumer guide.

Community engagement (service as action)

Focus on: awareness raising / advocacy

The C Too much traffic? activity can act as a springboard for student advocacy for traffic safety - this is a topic that is also returned to in the next unit, in B Crash! part 1 and C Crash! part 2. Students could run an awareness-raising campaign in the school, perhaps targeted also on Primary / Elementary-age children.  The consumer guide that students write for D Keeping motion safe could be a starting point for such a campaign.

Interdisciplinary transfer

Transferable conceptual understanding: Change: development and progress bring both improvement and new challenges

There are opportunities here for connection and transfer with Individuals and Societies, both through the themes of traffic and through the theme of a 'smaller world'. For example, students can use their understanding of the physics of motion to look at global transportation of goods by sea, land and air.

All materials on this website are for the exclusive use of teachers and students at subscribing schools for the period of their subscription. Any unauthorised copying or posting of materials on other websites is an infringement of our copyright and could result in your account being blocked and legal action being taken against you.

Help