Grab bag: Motion graphs

This is a quick online activity to stimulate students in accessing prior learning and maybe to prompt further inquiry
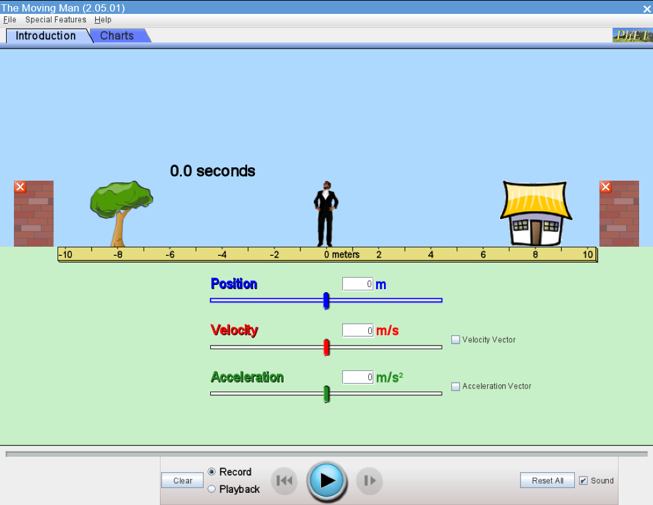
Click here to open the 'running man' simulation on PheT.
Play with the simulation.
Set the values below and sketch graphs for
s against t
v against t
a against t
| Run 1 | Run 2 | Run 3 |
| s = - 10 m | s = 0 m | s = - 10m |
| u = 2 m/s | u = 0 m/s | u = 4 m/s |
| a = 0 m/s2 | a = 1 m/s2 | a = -5 m/s2 |
Now use the 'charts' tab to check your sketch graphs.
Describe the motion of the running man in each case. Explain how the motion graphs represent the motion at each stage in his journey.
Teacher only box
This task can be used to check for understanding / formatively assess in criterion A: Knowing and Understanding. Marking notes and a student can-do sheet can be found here.
All materials on this website are for the exclusive use of teachers and students at subscribing schools for the period of their subscription. Any unauthorised copying or posting of materials on other websites is an infringement of our copyright and could result in your account being blocked and legal action being taken against you.