Maybe just a simulation?
Introducing a simulation that you can offer students who still need to start their IA.
The Internal Assessement (IA) upload deadline is April 20, so we are getting into crunch time to get those IAs done, marked, and sent off. But sometimes students draaaaag their heels and take forever to finish their work. Or even worse, whatever the reason, they never actually start to do anything until the very last possible moment. It can be stressful to make sure they get something reasonable finished (and marked) in time to upload.
We want to share a new tool that might be helpful if you have students who still haven't started their IA (or need to re-start, or maybe even a year one student who wants to try it?). We'll keep the student page free and available, even to schools that don't have a ThinkIB Physics license this year, at the following address. Likewise, this blog post will also be freely available, so please pass this page along to other teachers who might find this useful
https://thinkib.net/physics/page/67412/simulation-ia
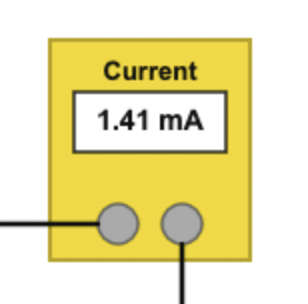
The tool is a simulation of one of the most popular IAs: measuring the resistivity of a graphite strip. In the lab, this experimental is often done using pencil lead, nichrome wire, or a thick pencil line on paper. In the simulation, students see a 1.5 V battery connected to a graphite strip, manipulate the locations of the two leads touching the strip, and measure the current flowing through the system.
Unlike most physics simulations, this one is designed for IA work. This means that:
- The current data is “noisy”, which should encourage students to conduct multiple trials and calculate the average and uncertainty (e.g., using the half-the-range rule).
- The length is measured by eye, so students will need to correctly account for measurement uncertainty using a ruler in the regular way.
- The data gives a graph that looks like a y=1/x function to prompt linearization.
- There is a systemic error that students should be able to figure out: internal resistance in the battery. This means that only one of the two ways to linearize the graph will work correctly (and students should be able to figure this out).
- If a correctly linearized graph is drawn, students can determine the internal resistance of the battery. If they look up the resistivity of graphite, they can determine that the thickness of the graphite strip is around 25 nm, which is an interesting (and typical) result.
- As of the first half of 2026, publicly available AIs are not able to manipulate the simulation to collect data, so students will have to at least do that, making a simulation slightly more AI-proof than a database investigation.
In short, this is an easy-to-start experiment that gives students plenty of scope to demonstrate their skills at collecting and analyzing data. If you use the simulation, leave a comment below to let us know how it went!