Spearman's Rank Correlation Coefficient

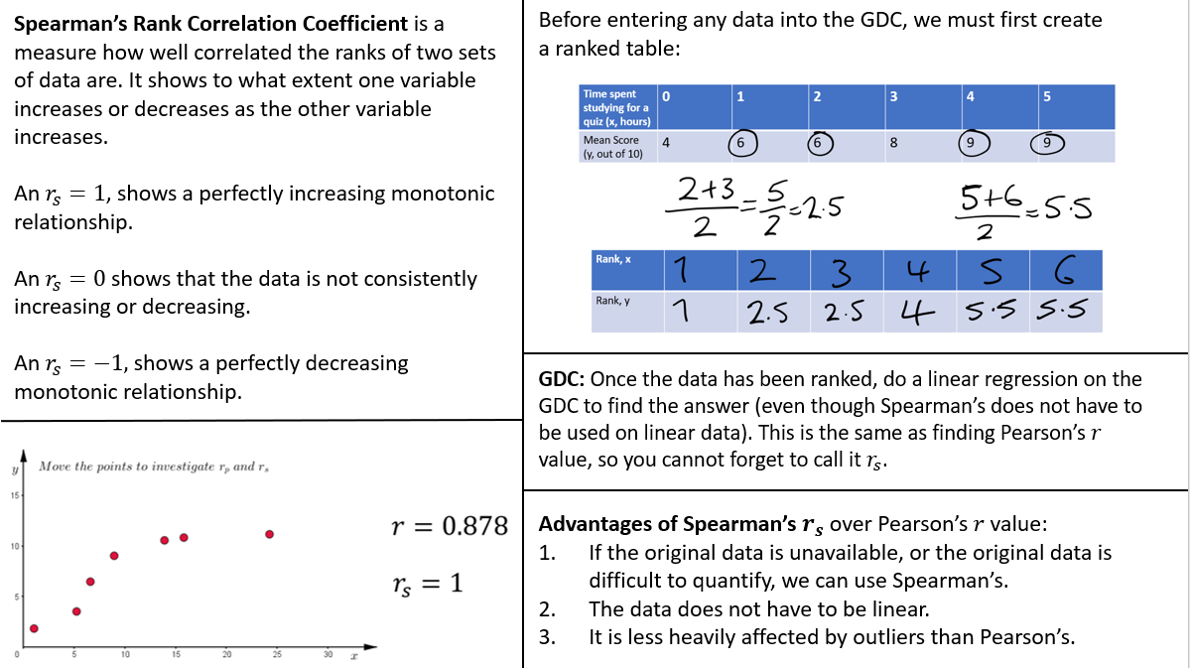
Analysing how closely two things are correlated is incredibly useful to ascertain exactly how strongly one variable affects another. Whilst helpful if the data is approximately linear, Pearson's Product Moment Correlation Coefficient can be insufficient when analysing connections in the real world. This is especially the case when variables are difficult to measure or quantify, such as judging the quality of different dancers, or the taste of different foods, for example. Hence, we may need a different correlation coefficient in specific cases.
In this unit you should learn to…
- Understand the difference between Pearson's Product Moment Correlation Coefficient and Spearman's Rank Correlation Coefficient.
- Create a ranked table.
- Use your GDC to find Spearman's Rank Correlation Coefficient.
- Interpret what the Spearman's Rank Correlation Coefficient means in a specific context (see quiz questions and exam style questions for this).
Self Checking Quiz
Practice your understanding on these quiz questions. Check your answers when you are done and read the worked solutions when you get stuck. If you find there are still some gaps in your understanding then go back to the videos above.
Estimate Spearman's rank correlation coefficient, \(r_{s}\), for the following scatter graph.
.png)
The data is strictly increasing, with the exeption of the final point, and given that the final point is still relatively close to the previous point, \(r_{s}\), is high.
Estimate Spearman's rank correlation coefficient, \(r_{s}\), for the following scatter graph.
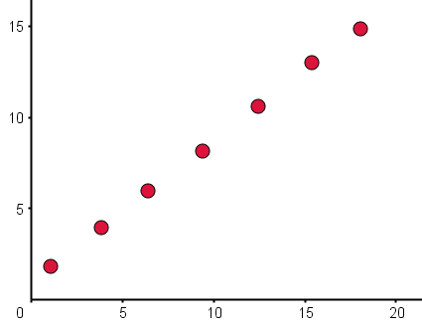
Given the data is strictly increasing (monotonic), \(r_{s}\) equals one.
Estimate Spearman's rank correlation coefficient, \(r_{s}\), for the following scatter graph.
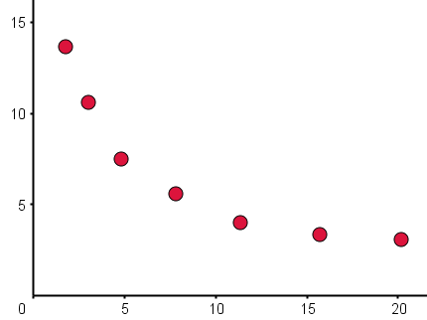
Given the data is strictly increasing (monotonic), \(r_{s}\) equals minus one.
Two judges score a diving competition with five competitors. After ranking the scores, the \(r_{s}\) value is found to be 0.952. Comment on \(r_{s}\)in this context.
See answer above.
The amount of time studying for a Biology test is compared with the assessment scores. The \(r_{s}\) value for the data was 0.650. Interpret this value.
See answer above.
Before calulating Spearman's Rank Correlation Coeffiient, we create a ranked table. Create a ranked table for the data below. Rank from smallest to largest.
| x | 2 | 2 | 5 | 3 | 8 |
| y | 3 | 2 | 3 | 4 | 7 |
| Rank, x | |||||
| Rank, y |
Given that the first position and second position are equal for the variable x, we average these positions to get 1.5 in each case. This is similarly the case for the second and third position for variable y, giving 2.5 for these positions. Note that it is equally valid to rank from largest to smallest, as long as you do this for bothh variables.
The temperature of coffee is taken over time. The results are given in the table below.
| Time (t), mins | 0 | 10 | 20 | 30 | 40 |
| Temperature, T, celsius | 68 | 45 | 30 | 25 | 25 |
Find \(r_{s}\)
The ranked table should be:
| Rank Time | 1 | 2 | 3 | 4 | 5 |
| Rank Temperature | 5 | 4 | 3 | 1.5 | 1.5 |
After inserting this data into your GDC, you find \(r_{s}\) to be - 0.975.
The table below shows a class sample of study time compared with scores on a test.
| Study Time, t | 1 | 1 | 5 | 3.5 | 1 | 4 |
| Score, S | 68 | 60 | 92 | 70 | 64 | 80 |
Fill in the gaps in the ranked table below.
| Study Time, t | 6 | 4 | 5 | |||
| Score, S | 3 | 1 | 6 | 4 | 2 | 5 |
Given that the first, second and third position for time spent studying are the same, we will find the average of these positions by adding them and dividing by three. In this case, that gives a rank of 2 for all three empty boxes.
From the list below, pick the advantages of using Spearman's rank correlation coefficient rather than Pearson's product moment correlation coefficient.
See answers above.
A set of data is strictly increasing. If the final data point is brought below the previous data point, but so that it is still above all other data points. How will this effect \(r_{s}\)?
See answer above.
.png)
.png)
.png)