Normal Distribution
Normal?
The normal distribution is a fascinating, naturally occurring phenomenon that has very relevant applications to understanding the world around us. When a data set is normally distributed it has some key properties that allow us to make predictions about the nature of the data set. The videos below go in to detail about those properties and how to use them to solve problems.


Self checking quiz
Practice your understanding on these quiz questions. Check your answers when you are done and read the hints where you got stuck. If you find there are still some gaps in your understanding then go back to the videos and slides above.
Tick the boxes next to statements you think are true.
If a data set is normally distributed then we would expect it...
The ditribution below shows a data set that is normally distributed with a mean of 50 and standard deviation of 10. For each region (labelled A - D) say the percentage of results you would expect to find.
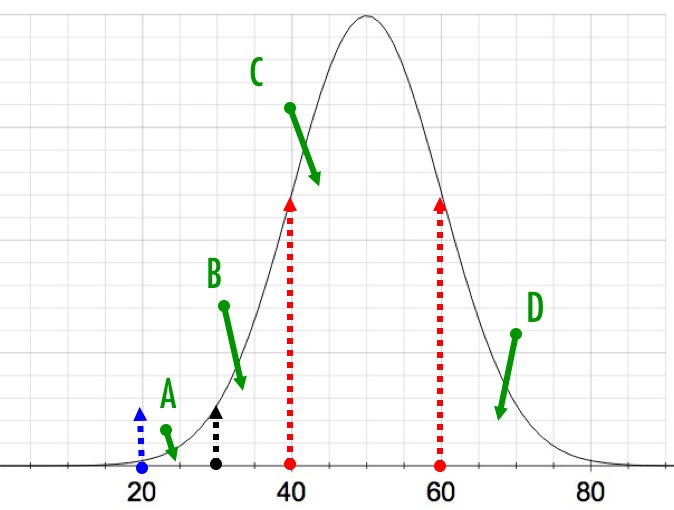
A %, B %, C %, D %
Based on the approximations, 68% +/-1sd, 95% +/-2sd, 99% +/-3sd and the symmetry of the diagram
The diagram below shows the normal distribution curve for a data set with a mean of 30 and standard deviation of 5. What pecentage of the data set should be represented by the shaded area.
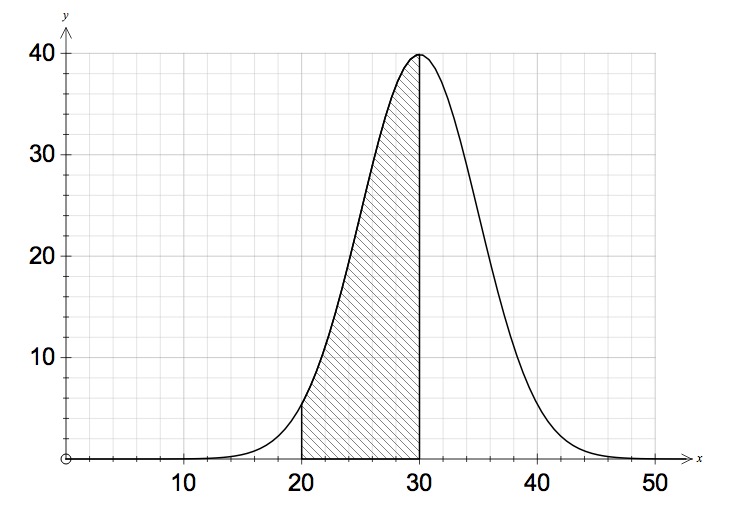
%
20 is 2 standard deviations below 30. Between 20 and 40 we would expect 95% of the results. As such between 20 and 30 should be half of that.
The diagram below shows the normal distribution curve for a data set with a mean of 30 and standard deviation of 5. What pecentage of the data set should be represented by the shaded areas A and B?
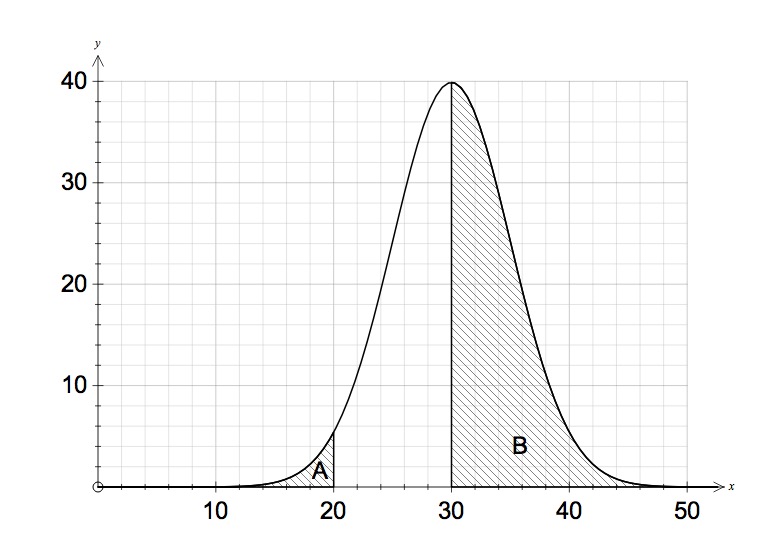
A %, B %
Consider a data set that is normally distributed with a mean of 40 and standard devisation of 7. Calculate the probability that a data item selected at random will be in the categories listed below. (give answers correct to 3 sf)
a) Less than 30,
b) Greater than 45,
c) Between 42 and 46,
Enter the Normal CDF function using the Mean, Standard deviation, Lower limit and upper limit.
Consider a data set that is normally distributed with a mean of 4.5 and standard devisation of 0.6. Calculate the probability that a data item selected at random will be in the categories listed below. (give answers correct to 3 sf)
a) Less than 3,
b) Greater than 4.7,
c) Between 4 and 6,
Enter the Normal CDF function using the Mean, Standard deviation, Lower limit and upper limit.
The weights of a sample of new born babies are normally distributed with a mean of 3.1kg and a standard deviation of 0.8 kg. Find the probability that a baby selected at random from that sample weighed.
a) More than 4kg,
If the sample contained 1500 babies, how many babies would you expect to be more than 4kg?
babies (nearest whole number)
Enter the Normal CDF function using the Mean, Standard deviation, Lower limit and upper limit. Then mutiply the probability by 1500.
Consider a data set that is normally distributed with a mean of 40 and standard devisation of 7. The probability of a data item selected at random being less than x, is given by 0.7.
What is the value of x? (3 sf)
Use the inverse normal function with Area/Probability = 0.7, Mean = 40, sd = 7. Round correctly
Consider a data set that is normally distributed with a mean of 4.5 and standard devisation of 0.6. The probability of a data item selected at random being more than x, is given by 0.45.
What is the value of x? (3 sf)
Use the inverse normal function with Area/Probability = 0.55, Mean = 40, sd = 7. Probability is 0.55 because that would leave 0.45 to the right. 0.55 is the probability on the left. Round correctly
The weights of a sample of new born babies are normally distributed with a mean of 3.1kg and a standard deviation of 0.8 kg. The bottom 10% of the sample were all below x kg.
What is the value of x? (3 sf)
Use the inverse normal function with Area/Probability = 0.1, Mean = 3.1, sd = 0.8. Round correctly
......
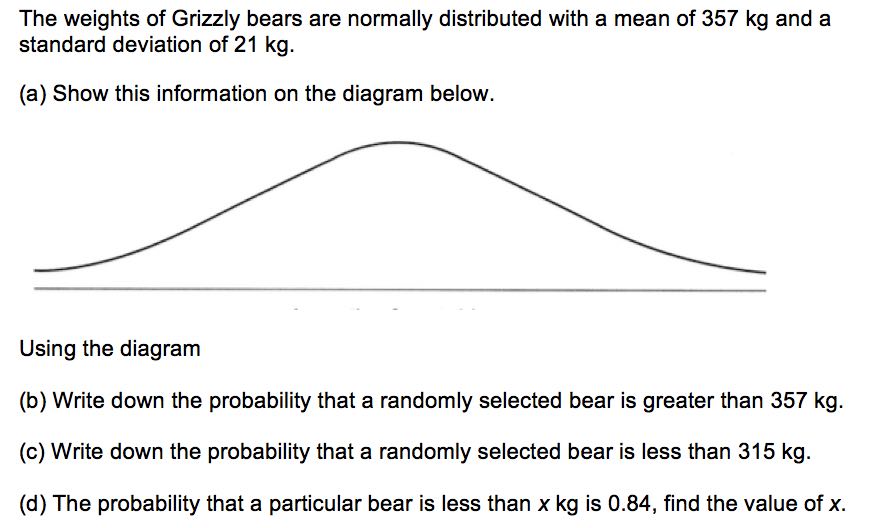
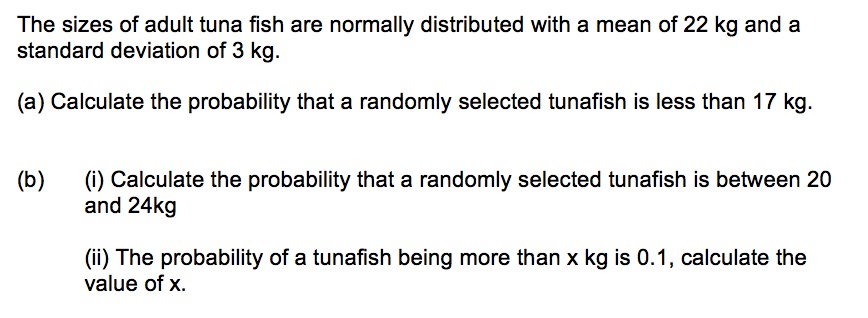
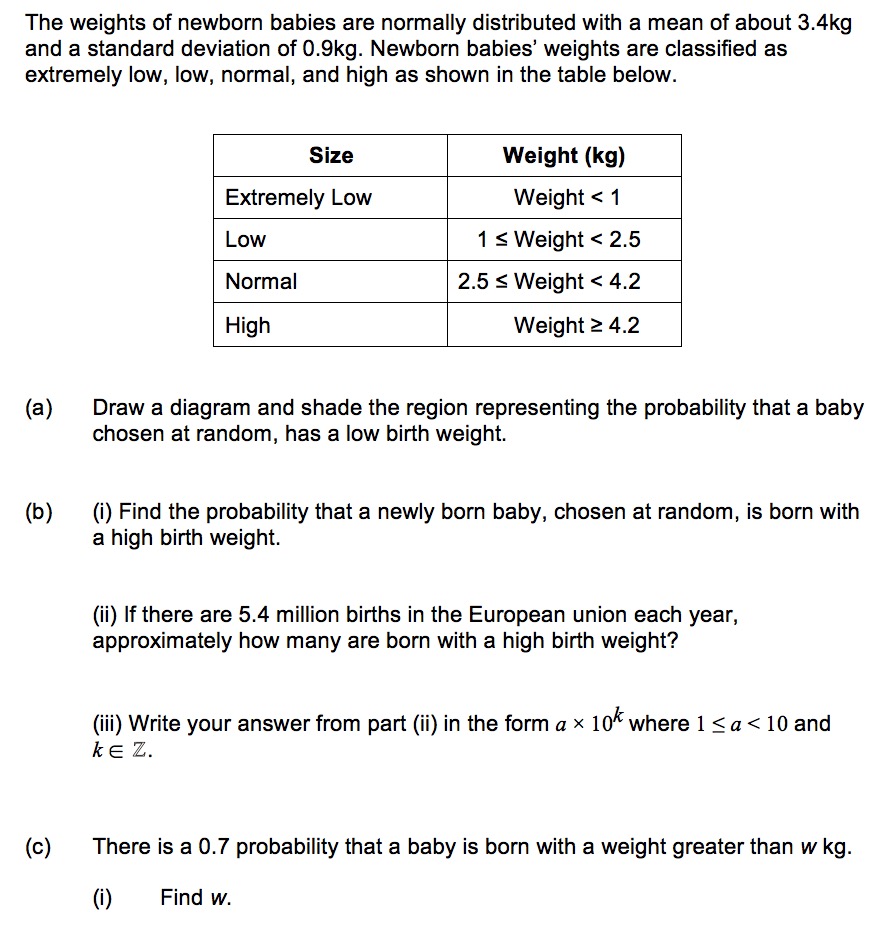
The following questions are based on IB exam style questions from past exams. You should print these off (from the document at the top) and try to do these questions under exam conditions. Then you can check your work with the video solution.