Interactive textbook: Graphs of motion
Straight lines and parabolas
 A graph is a visual representation of the relationship between two quantities.
If the graph is a straight line, the relationship is linear and the equation relating the quantities is of the form \(y = Ax + B\) where \(A\) is the gradient and \(B\) is the intercept on the \(y\)-axis.
If the relationship is quadratic (of the form \(y =Ax^2 + Bx +C\)) the graph is a parabola. A parabola is a curve with increasing gradient. The effect of varying \(A\), \(B\) and \(C\) is a bit more complicated and best shown in an animation.

What is the equation of this line?
Watch the animation.
y = 0 when x = 0 and x = -2.3
Displacement vs time graphs
Constant velocity
If the velocity is constant, the equation relating displacement and time is \(s = s_0 + vt \) where \(s_0\) is the original displacement and \(v\) is the velocity. This is a linear equation; the graph of \(s\) vs \(t\) is therefore a straight line with gradient \(v\) and intercept \(s_0\).
Here is an example with initial displacement \(2\text{ m}\) and velocity \(1\text{ m s}^{-1}\):

We can see that the intercept is \(2\text{ m}\) and the gradient \({Δy\over Δx}=1\text{ m s}^{-1}\).
So the motion is like this:
Now let's look at another example.
The initial displacement is \(3\text{ m}\) and the velocity \(-2\text{ m s}^{-1}\).

This is a displacement - time graph.

What is the initial displacement and velocity?
intercept = 5 m and gradient = -1 ms-1
Constant acceleration
If the acceleration is constant, the equation relating \(s\) and \(t\) is \(s = s_0 + ut + {1\over 2}at^2 \) and so the graph will be a parabola.
A body starts from rest at at displacement zero and has an acceleration of \(1\text{ m s}^{-2}\). The graph will look like this:

We can see that the gradient increases with time indicating an increase in velocity. Note that the gradient at \(t = 0\) is zero. The value of \(A\) in the quadratic equation \(y = Ax^2 + Bx + C\) is \(0.5\). This is equal to \({1\over2} a\).
For the same motion, imagine we started the clock as the ball passed the \(2\text{ m}\) mark. The initial displacement would be \(2\text{ m}\) and the initial velocity would be \(2\text{ m s}^{-1}\).
The velocity as the ball passes \(2\text{ m}\) can be calculated using the 'suvat' equations, taking the position of zero displacement as the start:
\(v^2=u^2+2as=0+2\times 1\times 2=4\)
\(v=\sqrt{4}=2\text{ m s}^{-1}\)
The overall shape of parabola is unchanged, but it has been translated:

The gradient at \(t = 0 \) is now \(2\text{ m s}^{-1}\):

If the acceleration was negative, the parabola would turn upside-down.

Here the initial velocity is \(2\text{ m s}^{-1}\) and the initial displacement is \(2\text{ m}\) with an acceleration of \(-1\text{ m s}^{-2}\).
The clock is started when the ball passes the \(2\text{ m}\) mark.
This is a displacement - time graph with acceleration 4 m s-2.

What is the initial velocity?
When t = 0 the gradient = 4 m s-1
Sketching graphs
The graphs on this page were made using GeoGebra. It is very difficult to draw them properly by hand but in the exam you might be asked to sketch one. If this is the case, don't panic. You are not expected to get the gradients correct.
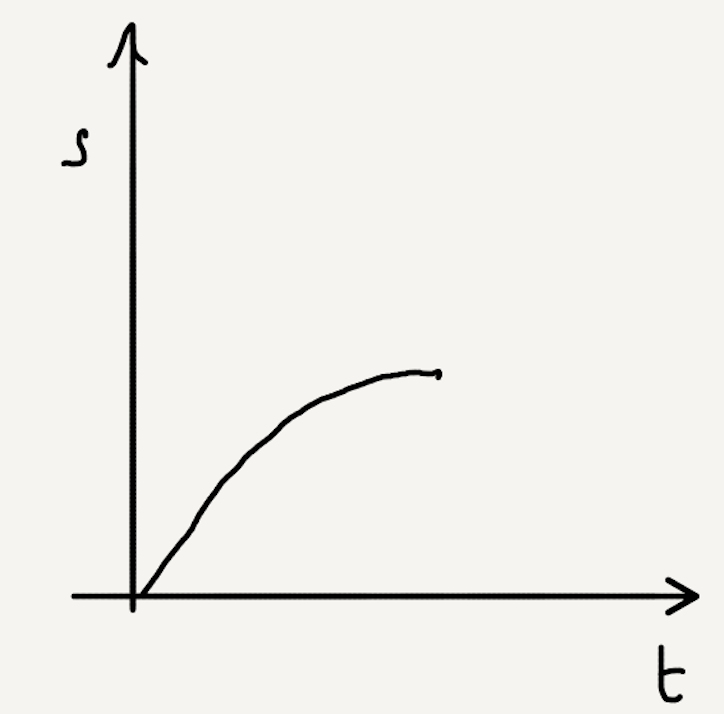
Example: A ball is kicked with an initial speed of \(5\text{ m s}^{-1}\). It rolls along a horizontal surface then up the hill where it stops and then rolls back down returning to the kicker. Sketch a displacement vs time graph for the vertical component of its motion.

For the first part of the motion the ball has no vertical displacement but when it reaches the hill it will move up with negative acceleration.

- 1 mark for the inverted parabola
- 1 mark for starting it at some time after t = 0 s
Velocity vs time graphs
The equation relating velocity and time is \(v = u + at\),. This is a linear equation so a graph of velocity against time will be a straight line with gradient \(a\) and \(y\)-intercept \(u\).
This graph represents a body with a constant velocity of \(2\text{ m s}^{-1}\). There is no acceleration so the gradient is \(0\text{ m s}^{-2} \):

The next one represents a body with initial velocity of \( 2\text{ m s}^{-1}\) accelerating at \(1\text{ m s}^{-2}\):

If the acceleration is negative then the gradient is negative:

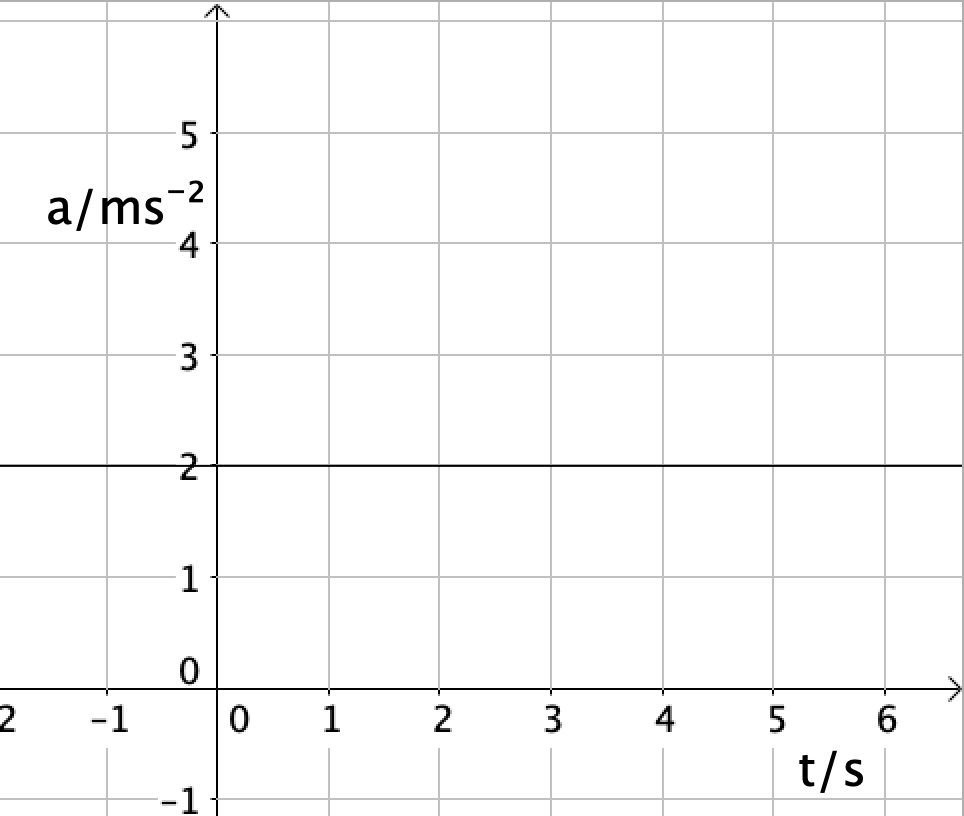
Acceleration vs time graphs
Given that acceleration is generally constant, a graph of acceleration vs time is easy to draw.
This graph represents an acceleration of \(2\text{ m s}^{-2}\):
If the acceleration is \(-2\text{ m s}^{-2}\) the line is below the \(t\)-axis:

So, what goes wrong? You must remember that the sign of acceleration does not change when the direction of motion changes: constant means constant.
In this example the acceleration is always \(-1\text{ m s}^{-2}\) (except when the gif restarts!).
Which of the following graphs represents the motion of the ball in the previous animation?

The acceleration is constant and negative except whe the ball sudenly changes direction on the left.
Changing acceleration
Although we only consider motion with constant acceleration, you might be asked to sketch a graph for examples where the acceleration changes from one constant value to another. In these examples you just need to take each section in turn.
Example: Sketch displacement vs time, velocity vs time and acceleration vs time graphs for the horizontal component of the motion of a ball rolling over the hill in the diagram below. The ball starts on the left with enough speed to just get over the hill:

The first part of the motion is from the start to the top. The body has a non-zero initial velocity and negative acceleration. At the top its velocity is almost zero. The displacement vs time graph will be an inverted parabola:
On the way down it has positive acceleration so the parabola is inverted. The acceleration is less so the parabola is more open and the time taken to get down is greater. The gradient at the end should actually be greater than the start but that might be getting into too much detail for a sketch.
The reason for this is that we are considering the horizontal component of motion. The horizontal component of velocity is \(v\cosθ\) where \(θ\) is the angle of the slope. The speed at the end is equal to the speed at the start (due to the conservation of energy) so, since the angle is lower at the end, \(v\cosθ\) will be greater.
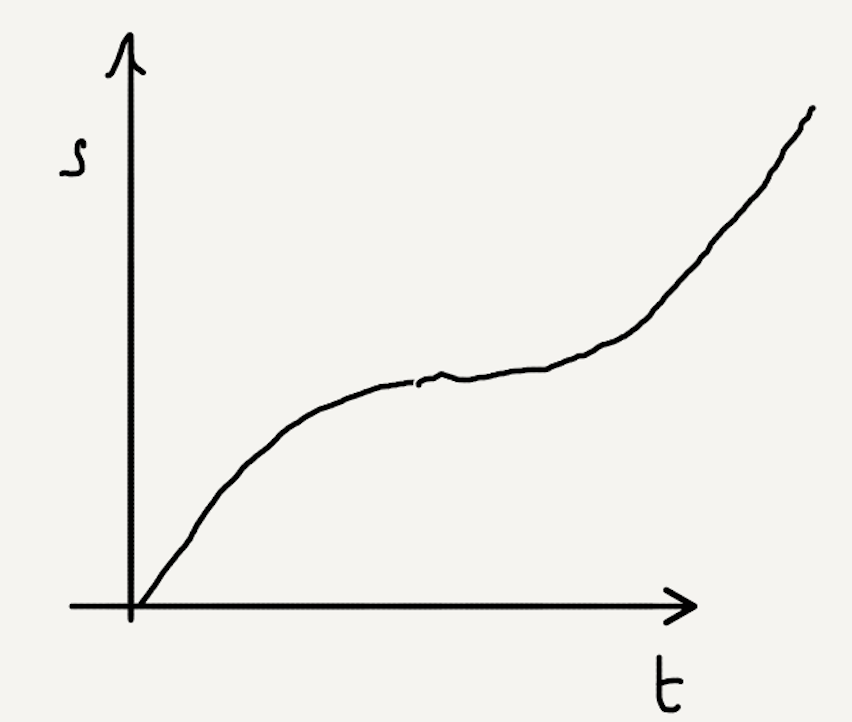
Note that there should be a smooth transition between the two parts. A kink would imply infinite acceleration!
To draw the velocity vs time graph you can either consider the motion or the gradient of the displacement vs time graph.
Negative acceleration means a negative gradient so the first part has negative gradient starting from some positive value ending close to zero. The second part has a positive gradient ending with a velocity greater than the start. The gradient of the second part is lower than the first. The second part should have a longer time than the first.

The acceleration vs time graph is simply the gradient of the velocity vs time graph.
A constant negative value for the first part and a smaller positive value for the second.

Area under the graph
The area under a graph is the area between the line and the \(x\)-axis. It has a real-world meaning that varies depending on the axes quantities. With straight line graphs, the area can be found by calculation but in non-linear examples it must be estimated by counting squares.
In this example it is the area of a rectangle (\(15\)):

But in this one it is the area of a triangle (\({1\over2}\times \text{base} \times \text{height} = 10\)):

This one is a trapezium (\({1\over2}\times \text{sum of parallel sides} \times \text{height} = {1\over 2}(A+B)\times C=12\)):

Let's consider the area under a velocity vs time graph. The area gives the displacement.

The area is \(vt = 15\text{ m}\), which is the displacement. We can see that this ties in with the 'suvat' equations.

Here, the area is \({1\over2} (u+v)t=12\text{ m}\).
If the line is under the \(x\)-axis, the area is negative. In the following example the final displacement is \(0\text{ m}\):

This is an velocity - time graph.
What is the displacement from 2 - 4 s?
Area = 3 x 2 + 1/2 x 1 x 2 = 7 m
The area under an acceleration vs time graph is also significant. This gives the change in velocity. We can see this from the 'suvat' equation \(at = v - u\)..

In this case, the area is \(20\text{ m s}^{-1}\) and this is equal to the change in velocity.
This is an acceleration - time graph.

What is the change of velocity from 0 - 4 s?
Area = 1/2 x 4 x 4