<turbo-stream action="append" target="section-items">
    <template>
            <a href="/ess/page/48213/line-graphs" class="card text-body rounded-0 text-decoration-none" data-turbo-frame="_top" data-turbo="false">
        <div class="card-body">
            <div class="row align-items-start gx-3">
                <div class="col-4 col-lg-3">
                    <div class="rounded overflow-hidden hover-zoom hover-overlay">
        <img
            class="d-block w-100 height-150 object-cover"
            src="https://teacher-sites-storage.inthinking.net/ib/ess/images/statistics/graphs-line-720x720.jpg"
            alt="Line graphs"
        >
    </div>

                </div>
                <div class="col-8 col-lg-9">
                                            <h6 class="text-accent">
                            eBook
                        </h6>
                                        <h5 class="fw-semibold text-primary mb-2 d-flex gap-1 align-items-end">
                        Line graphs
                                    

                    </h5>
                                            <p class="text-body mb-0 mb-lg-3"> Line graphs tell the story of how something has changed over time.  Your data needs to be numerical (such as lengths, temperatures, percentages or weights) and measured over a time period (such as a week...</p>
                                        <div class="clearfix">
                        <span class="text-muted fs-sm float-end">
                            21 May 2025
                        </span>
                    </div>
                </div>
            </div>
        </div>
    </a>
    <a href="/ess/page/48232/kite-diagrams" class="card text-body rounded-0 text-decoration-none" data-turbo-frame="_top" data-turbo="false">
        <div class="card-body">
            <div class="row align-items-start gx-3">
                <div class="col-4 col-lg-3">
                    <div class="rounded overflow-hidden hover-zoom hover-overlay">
        <img
            class="d-block w-100 height-150 object-cover"
            src="https://teacher-sites-storage.inthinking.net/ib/ess/images/statistics/kite-square-411x411.png"
            alt="Kite Diagrams"
        >
    </div>

                </div>
                <div class="col-8 col-lg-9">
                                            <h6 class="text-accent">
                            eBook
                        </h6>
                                        <h5 class="fw-semibold text-primary mb-2 d-flex gap-1 align-items-end">
                        Kite Diagrams
                                                <span class='topic-heading-badge d-inline-flex align-items-center justify-content-center'>Free</span>

                    </h5>
                                            <p class="text-body mb-0 mb-lg-3"> Kite diagrams provide a graphical summary of different observations made along a transect. When to use  Features Kite diagrams provide a graphical summary of different observations made along a transect. ...</p>
                                        <div class="clearfix">
                        <span class="text-muted fs-sm float-end">
                            21 May 2025
                        </span>
                    </div>
                </div>
            </div>
        </div>
    </a>
    <a href="/ess/page/48229/bubble-graphs" class="card text-body rounded-0 text-decoration-none" data-turbo-frame="_top" data-turbo="false">
        <div class="card-body">
            <div class="row align-items-start gx-3">
                <div class="col-4 col-lg-3">
                    <div class="rounded overflow-hidden hover-zoom hover-overlay">
        <img
            class="d-block w-100 height-150 object-cover"
            src="https://teacher-sites-storage.inthinking.net/ib/ess/images/statistics/graphs-bubble-720x720.jpg"
            alt="Bubble Graphs"
        >
    </div>

                </div>
                <div class="col-8 col-lg-9">
                                            <h6 class="text-accent">
                            eBook
                        </h6>
                                        <h5 class="fw-semibold text-primary mb-2 d-flex gap-1 align-items-end">
                        Bubble Graphs
                                    

                    </h5>
                                            <p class="text-body mb-0 mb-lg-3"> Bubble graphs are a variation of X-Y scatter graphs where the size of the plotted points indicates the frequency of that data point. These graphs can be complicated to interpret so they should be used...</p>
                                        <div class="clearfix">
                        <span class="text-muted fs-sm float-end">
                            21 May 2025
                        </span>
                    </div>
                </div>
            </div>
        </div>
    </a>
    <a href="/ess/page/48231/box-whisker-plots" class="card text-body rounded-0 text-decoration-none" data-turbo-frame="_top" data-turbo="false">
        <div class="card-body">
            <div class="row align-items-start gx-3">
                <div class="col-4 col-lg-3">
                    <div class="rounded overflow-hidden hover-zoom hover-overlay">
        <img
            class="d-block w-100 height-150 object-cover"
            src="https://teacher-sites-storage.inthinking.net/ib/ess/images/statistics/graphs-box-whisker-720x720.jpg"
            alt="Box &amp; Whisker Plots"
        >
    </div>

                </div>
                <div class="col-8 col-lg-9">
                                            <h6 class="text-accent">
                            eBook
                        </h6>
                                        <h5 class="fw-semibold text-primary mb-2 d-flex gap-1 align-items-end">
                        Box & Whisker Plots
                                                <span class='topic-heading-badge d-inline-flex align-items-center justify-content-center'>Free</span>

                    </h5>
                                            <p class="text-body mb-0 mb-lg-3"> Box & whisker plots (also called five-number summary plots) show the minimum, first quartile, median, third quartile and maximum values of a data set.   When to use  Features Box-and-whisker plots show...</p>
                                        <div class="clearfix">
                        <span class="text-muted fs-sm float-end">
                            21 May 2025
                        </span>
                    </div>
                </div>
            </div>
        </div>
    </a>
    <a href="/ess/page/48214/bar-charts-histograms" class="card text-body rounded-0 text-decoration-none" data-turbo-frame="_top" data-turbo="false">
        <div class="card-body">
            <div class="row align-items-start gx-3">
                <div class="col-4 col-lg-3">
                    <div class="rounded overflow-hidden hover-zoom hover-overlay">
        <img
            class="d-block w-100 height-150 object-cover"
            src="https://teacher-sites-storage.inthinking.net/ib/ess/images/statistics/graphs-bar-720x720.jpg"
            alt="Bar Charts &amp; Histograms"
        >
    </div>

                </div>
                <div class="col-8 col-lg-9">
                                            <h6 class="text-accent">
                            eBook
                        </h6>
                                        <h5 class="fw-semibold text-primary mb-2 d-flex gap-1 align-items-end">
                        Bar Charts & Histograms
                                    

                    </h5>
                                            <p class="text-body mb-0 mb-lg-3"> Both bar charts and histograms show how often something occurs.A bar chart shows the frequency of different events occurring. The height of each bar indicates the frequency of each event.If the values...</p>
                                        <div class="clearfix">
                        <span class="text-muted fs-sm float-end">
                            21 May 2025
                        </span>
                    </div>
                </div>
            </div>
        </div>
    </a>
    <a href="/ess/page/48256/measures-of-variability" class="card text-body rounded-0 text-decoration-none" data-turbo-frame="_top" data-turbo="false">
        <div class="card-body">
            <div class="row align-items-start gx-3">
                <div class="col-4 col-lg-3">
                    <div class="rounded overflow-hidden hover-zoom hover-overlay">
        <img
            class="d-block w-100 height-150 object-cover"
            src="https://teacher-sites-storage.inthinking.net/ib/ess/images/statistics/map-gc703ca2f61280-1084x720.jpg"
            alt="Measures of Variability"
        >
    </div>

                </div>
                <div class="col-8 col-lg-9">
                                            <h6 class="text-accent">
                            eBook
                        </h6>
                                        <h5 class="fw-semibold text-primary mb-2 d-flex gap-1 align-items-end">
                        Measures of Variability
                                    

                    </h5>
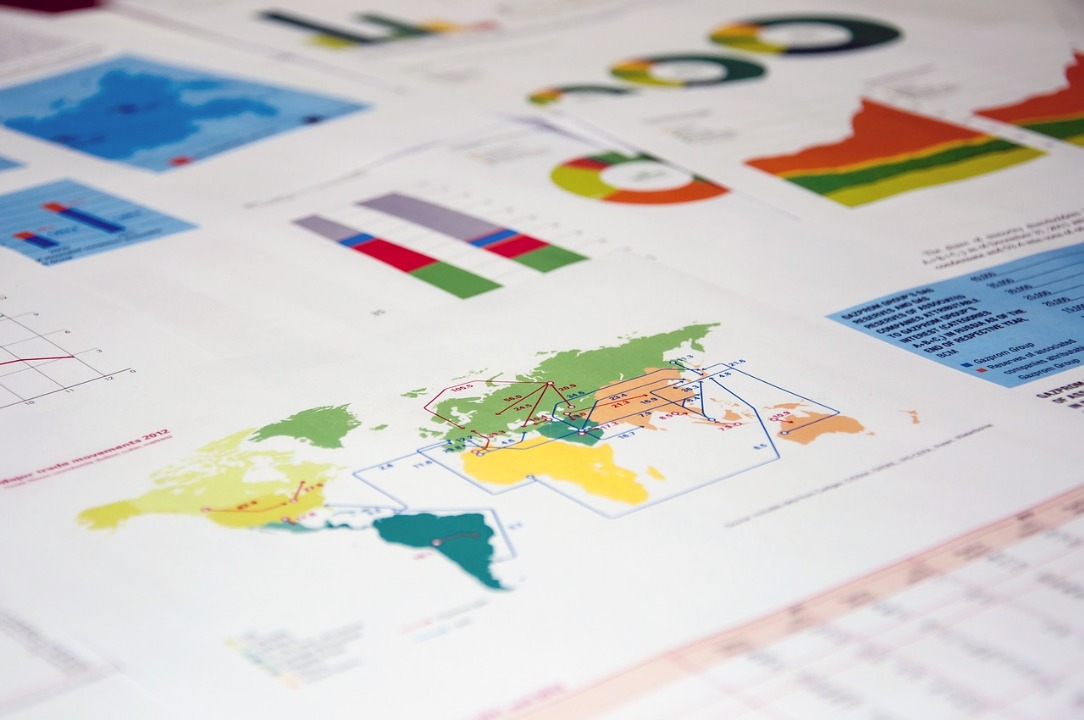
                                            <p class="text-body mb-0 mb-lg-3"> Measures of variability While a measure of central tendency describes the typical value in a data set, measures of variability define how far away the data points fall from the centre. A low spread/variability...</p>
                                        <div class="clearfix">
                        <span class="text-muted fs-sm float-end">
                            21 May 2025
                        </span>
                    </div>
                </div>
            </div>
        </div>
    </a>
    <a href="/ess/page/48253/measures-of-central-tendency" class="card text-body rounded-0 text-decoration-none" data-turbo-frame="_top" data-turbo="false">
        <div class="card-body">
            <div class="row align-items-start gx-3">
                <div class="col-4 col-lg-3">
                    <div class="rounded overflow-hidden hover-zoom hover-overlay">
        <img
            class="d-block w-100 height-150 object-cover"
            src="https://teacher-sites-storage.inthinking.net/ib/ess/images/statistics/financial-equalization-g863e8d89a1280-720x720.jpg"
            alt="Measures of Central Tendency"
        >
    </div>

                </div>
                <div class="col-8 col-lg-9">
                                            <h6 class="text-accent">
                            eBook
                        </h6>
                                        <h5 class="fw-semibold text-primary mb-2 d-flex gap-1 align-items-end">
                        Measures of Central Tendency
                                    

                    </h5>
                                            <p class="text-body mb-0 mb-lg-3"> Measures of central tendency are numbers that describe where the centre of a dataset is located. This section explains the differences between the mean, mode and median.  Mean, mode & median The arithmetic...</p>
                                        <div class="clearfix">
                        <span class="text-muted fs-sm float-end">
                            21 May 2025
                        </span>
                    </div>
                </div>
            </div>
        </div>
    </a>
    <a href="/ess/page/48251/outliers-in-your-data" class="card text-body rounded-0 text-decoration-none" data-turbo-frame="_top" data-turbo="false">
        <div class="card-body">
            <div class="row align-items-start gx-3">
                <div class="col-4 col-lg-3">
                    <div class="rounded overflow-hidden hover-zoom hover-overlay">
        <img
            class="d-block w-100 height-150 object-cover"
            src="https://teacher-sites-storage.inthinking.net/ib/ess/images/statistics/ladybugs-g7cd6876de1280-742x720.jpg"
            alt="Outliers in your Data"
        >
    </div>

                </div>
                <div class="col-8 col-lg-9">
                                            <h6 class="text-accent">
                            eBook
                        </h6>
                                        <h5 class="fw-semibold text-primary mb-2 d-flex gap-1 align-items-end">
                        Outliers in your Data
                                    

                    </h5>
                                            <p class="text-body mb-0 mb-lg-3"> Outliers are unusual values in your data. Unfortunately, there are no strict statistical rules for identifying them. But this section gives some guidelines and statistical tests you can use to identify...</p>
                                        <div class="clearfix">
                        <span class="text-muted fs-sm float-end">
                            21 May 2025
                        </span>
                    </div>
                </div>
            </div>
        </div>
    </a>
    <a href="/ess/page/48250/types-of-data" class="card text-body rounded-0 text-decoration-none" data-turbo-frame="_top" data-turbo="false">
        <div class="card-body">
            <div class="row align-items-start gx-3">
                <div class="col-4 col-lg-3">
                    <div class="rounded overflow-hidden hover-zoom hover-overlay">
        <img
            class="d-block w-100 height-150 object-cover"
            src="https://teacher-sites-storage.inthinking.net/ib/ess/images/statistics/coding-g4f59f2f331280-1080x720.jpg"
            alt="Types of Data"
        >
    </div>

                </div>
                <div class="col-8 col-lg-9">
                                            <h6 class="text-accent">
                            eBook
                        </h6>
                                        <h5 class="fw-semibold text-primary mb-2 d-flex gap-1 align-items-end">
                        Types of Data
                                    

                    </h5>
                                            <p class="text-body mb-0 mb-lg-3"> Once you have decided how you will isolate your sample, you need to start collecting data from it. This section defines the different types of data you might collect.  Types of data It is important that...</p>
                                        <div class="clearfix">
                        <span class="text-muted fs-sm float-end">
                            21 May 2025
                        </span>
                    </div>
                </div>
            </div>
        </div>
    </a>
    <a href="/ess/page/48236/populations-samples" class="card text-body rounded-0 text-decoration-none" data-turbo-frame="_top" data-turbo="false">
        <div class="card-body">
            <div class="row align-items-start gx-3">
                <div class="col-4 col-lg-3">
                    <div class="rounded overflow-hidden hover-zoom hover-overlay">
        <img
            class="d-block w-100 height-150 object-cover"
            src="https://teacher-sites-storage.inthinking.net/ib/ess/images/statistics/great-white-pelicans-g515b7b1cb1280-1080x720.jpg"
            alt="Populations &amp; Samples"
        >
    </div>

                </div>
                <div class="col-8 col-lg-9">
                                            <h6 class="text-accent">
                            eBook
                        </h6>
                                        <h5 class="fw-semibold text-primary mb-2 d-flex gap-1 align-items-end">
                        Populations & Samples
                                    

                    </h5>
                                            <p class="text-body mb-0 mb-lg-3"> Usually it is not practical to question everyone or record everything in a population, so a sample is chosen – a smaller group that belongs to the population. This section explains the differences between...</p>
                                        <div class="clearfix">
                        <span class="text-muted fs-sm float-end">
                            21 May 2025
                        </span>
                    </div>
                </div>
            </div>
        </div>
    </a>


    </template>
</turbo-stream>

    <turbo-stream action="update" target="load-more">
        <template>
            <div class="d-flex justify-content-center my-3">
    <a href="/ess/latest-updates?page=55" class="btn btn-secondary loader">
        <i class="fa-regular fa-circle-plus"></i>
        Load more
    </a>
    <div class="spinner-border load-more text-primary" role="status">
        <span class="visually-hidden">Loading...</span>
    </div>
</div>

        </template>
    </turbo-stream>